MetricMQ: Exploring Lightweight Messaging for Constrained Devices
Why I am building MetricMQ, the trade-offs it explores, and how to try its basic publish-and-subscribe flow without an ESP32.
Message brokers let applications exchange data without every producer maintaining a direct connection to every consumer. On a microcontroller, the protocol parser, buffers, reconnect logic, and security code all compete with the application for memory. MetricMQ started with a practical question:
Can I keep the device-side protocol predictable while retaining topic delivery, persistent message IDs, optional signing, and basic broker metrics?
MetricMQ is an experimental C++20 project, not a replacement for mature systems such as MQTT brokers, NATS, Redis, or RabbitMQ. Those tools have broader protocol support, larger communities, and years of production testing. MetricMQ deliberately supports fewer features. I am using it to test a specific design, not to argue that established brokers are too large for every embedded project.
This article explains the problem MetricMQ is trying to solve, describes its current design, and shows the smallest useful local demonstration. No ESP32 is required for this walkthrough.
The problem: connecting small devices to several services
Imagine a group of environmental sensors. Each device publishes temperature, humidity, or air-quality readings. That data may need to reach several systems:
- a dashboard for live monitoring;
- a database for long-term storage;
- an alerting service for abnormal values; and
- a diagnostic tool used during development.
Without a broker, a sensor may need to know the address and protocol of every service:
Sensor ---> Dashboard
       +--> Database
       +--> Alert service
This couples the device firmware to the rest of the system. Adding or replacing a consumer can require firmware changes, and every device must manage several connections.
A broker provides a meeting point instead:
Sensors ---> Message broker ---> Dashboard
                              +-> Database
                              +-> Alert service
The sensor publishes a message to a topic such as
sensors/room-1/temperature. Consumers subscribe to the topics they need. The
publisher does not need to know how many consumers exist or where they run.
MetricMQ focuses on the device-facing side of this familiar pattern.
Where existing tools fit
For most projects I would begin with an established broker. MQTT has a large IoT ecosystem; RabbitMQ offers extensive routing and delivery features; NATS targets high-performance messaging; and Redis Pub/Sub is convenient when Redis is already in the system.
Their cost depends on the broker, client library, security settings, and workload. I do not have a controlled comparison covering those combinations, so I removed the size table from the previous version of this post.
MetricMQ limits the scope and keeps the wire layout predictable. It currently has:
- A fixed-size binary frame header with known field offsets.
- Topic-based publish and subscribe through a small client API.
- Broker-assigned sequence IDs that survive a broker restart.
- Optional Ed25519 signatures attached to individual messages.
- A built-in HTTP endpoint for Prometheus-format metrics.
This feature list is not a benchmark. Performance and memory claims need a defined build, workload, and target device.
How MetricMQ currently works
MetricMQ accepts TCP connections on port 6379. A client can publish a payload
to a topic or subscribe to a topic and receive matching messages.
The native binary protocol begins each frame with a 16-byte header:
[Version: 1 byte][Command: 1 byte][Sequence: 8 bytes]
[Topic length: 2 bytes][Payload length: 4 bytes]
The topic and payload follow the header. This gives the decoder known field offsets; actual memory use still depends on the client implementation and payload size.
The same broker port can also recognize a subset of the Redis Serialization Protocol (RESP). This is useful during development because a desktop tool can use text-oriented commands while an embedded client uses binary frames. It does not mean MetricMQ implements the complete Redis feature set.
Sequence IDs and persistence
When the broker accepts a publish, it assigns a monotonically increasing sequence ID and stores the message state in LMDB. The high-water sequence therefore continues after a broker restart.
The sequence is global rather than per topic. The broker also holds one mutex while allocating the ID, writing to LMDB, and routing the message. That is a serialized hot path. I have not yet measured where contention becomes material, so the honest description is “simple ordering with an unmeasured concurrency limit.”
Optional message signatures
A binary publisher can attach an Ed25519 signature and key identifier. The broker
can verify that signature before routing the message. Invalid signatures are
rejected and recorded in metricmq_signature_failures_total.
The signature checks whether the message matches a known signing key and has remained unchanged. It does not hide the topic or payload, protect all connection metadata, or automatically prevent every replay scenario. MetricMQ message signing is therefore not a general replacement for TLS. A deployment still needs an appropriate transport and network-security design.
Try the basic flow locally
This walkthrough does four things: start the broker, connect a subscriber, publish a message, and inspect the broker’s metrics.
First, build the project using the instructions in the MetricMQ repository. Start the broker from the repository root.
On Windows PowerShell:
.\build-local\Release\metricmq-broker.exe
On Linux or macOS, depending on the selected build directory:
./build/metricmq-broker
The broker should report that it is listening on port 6379 and that its metrics
endpoint is available on port 9091.
Next, run the binary subscriber example in a second terminal:
./build/binary_sub_only
Then run the publisher example in a third terminal:
./build/binary_pub_only
On Windows, use the corresponding executables under build-local\Release. The
subscriber should display the published topic and payload.
This tests the essential path:
Publisher ---> MetricMQ ---> Subscriber
I removed the hand-written Python socket client from the previous article. It was more protocol tutorial than getting-started material; the maintained examples are a better first test.
Inspect the broker without a monitoring stack
MetricMQ exposes metrics directly over HTTP. Prometheus and Grafana are not required to verify that the broker is working.
curl http://localhost:9091/metrics
After the publish-and-subscribe test, useful values include:
metricmq_messages_published_total: publishes accepted by the broker;metricmq_messages_delivered_total: individual subscriber deliveries;metricmq_active_connections: currently open connections;metricmq_active_subscribers: live session-and-topic subscriptions;metricmq_topics: topic filters with at least one subscriber; andmetricmq_delivery_latency_seconds: time spent in the broker’s synchronous delivery operation.
Published and delivered totals measure different things. One publish sent to five subscribers creates one published message and five deliveries. A publish with no subscriber creates one published message and no delivery. Dividing these counters does not produce a valid message-loss percentage.
These values should agree with one another. Per-topic subscriber gauges must not report subscribers while both the active-subscriber and topic gauges report zero. If they disagree, that is an instrumentation defect, not a successful demonstration.
Optional: Prometheus and Grafana
For a longer test, Prometheus can collect the metrics over time and Grafana can display them. This tooling is useful during development, but it is much larger than the broker and is not part of MetricMQ’s runtime footprint.
The demo repository contains a provisioned Compose configuration:
docker compose -f monitoring/compose.yml up -d
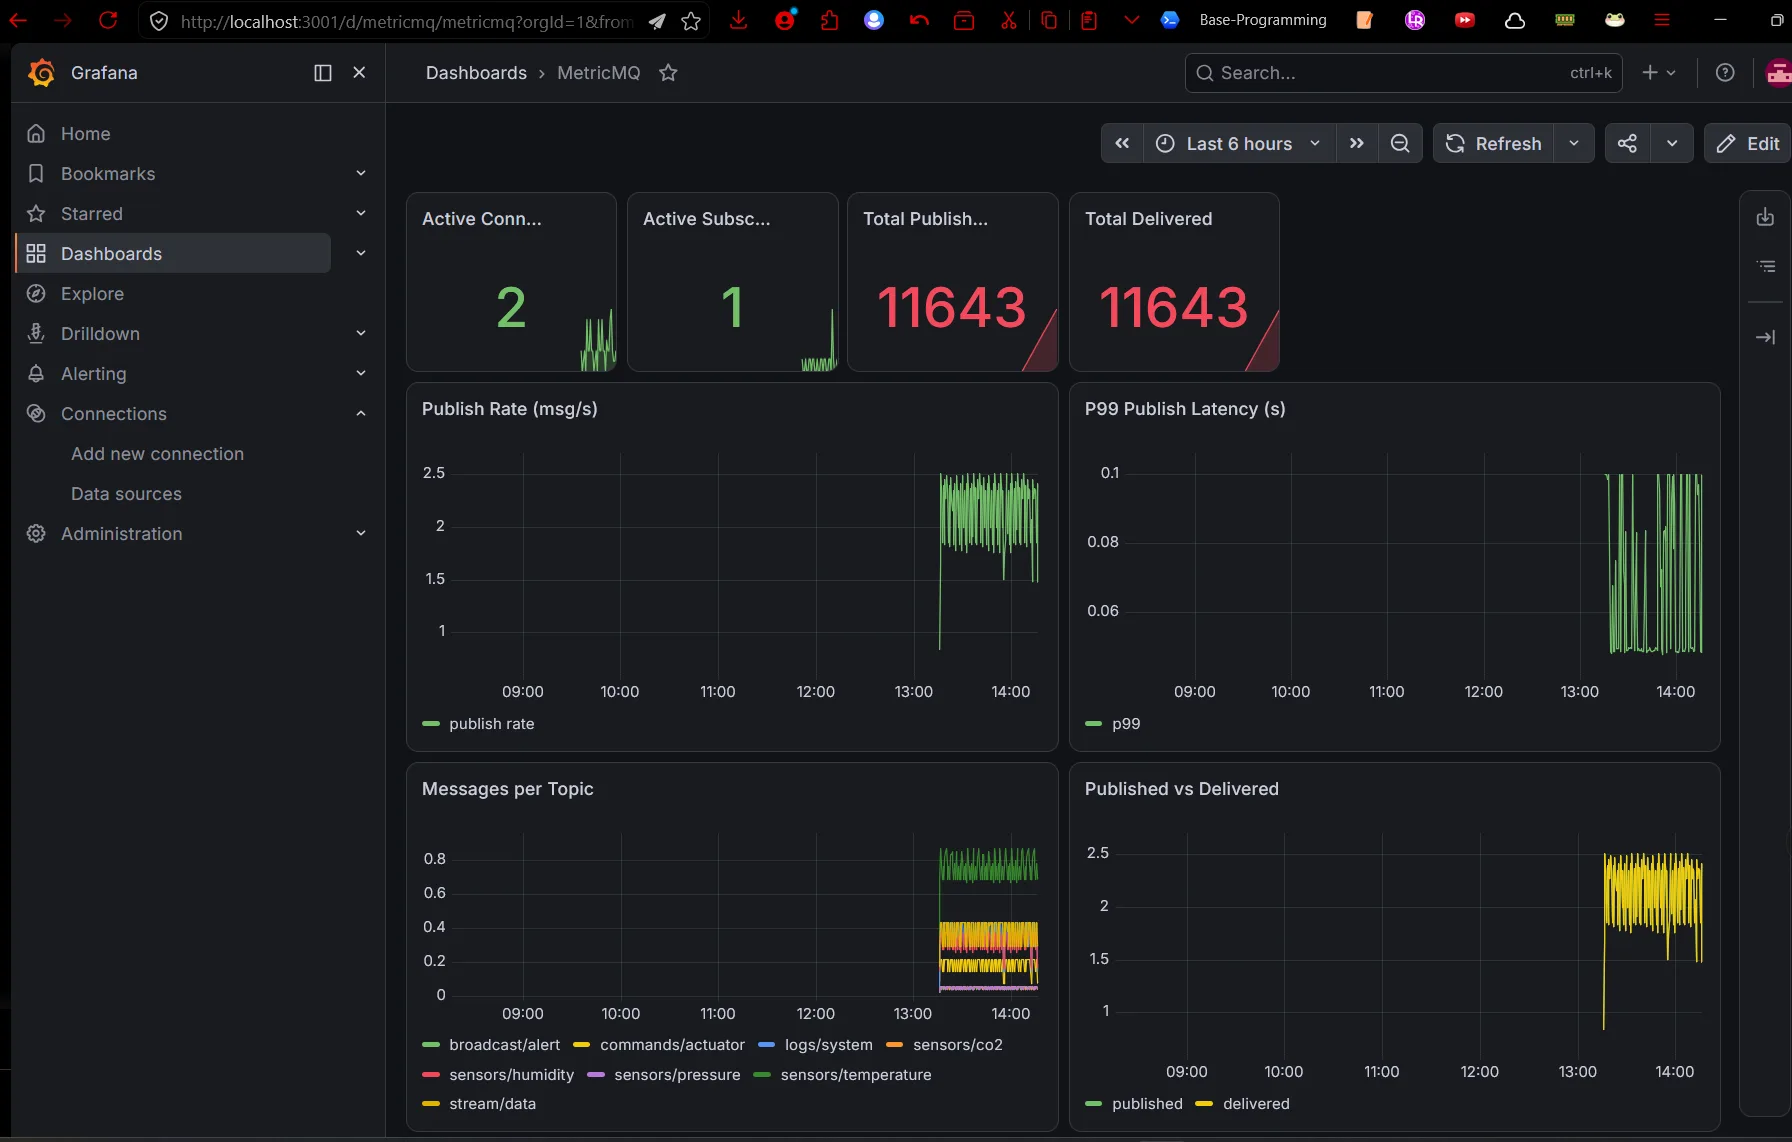
It starts Prometheus on http://localhost:9090 and Grafana on http://localhost:3001. The included dashboard uses a provisioned Prometheus datasource UID, avoiding version-sensitive manual datasource names during import.
I kept one dashboard screenshot because it shows the intended result. I removed the configuration screenshots: the UI changes between releases, while the Compose files are version-controlled and repeatable.
If all you want is proof that the broker routes messages and exports coherent
metrics, stop at curl. The dashboard is optional.
What the local test demonstrates
The local test demonstrates that:
- a publisher and subscriber can exchange a topic-based message;
- the broker assigns and persists message sequence IDs;
- the broker exposes its internal state in Prometheus format.
The source also contains RESP protocol detection and signed-publish verification, but the commands above do not exercise either path. They need separate tests before I present them as results of this walkthrough.
It does not demonstrate:
- memory use or reliability on an ESP32;
- performance under many concurrent publishers;
- behavior during packet loss or an unstable network;
- production-grade authentication and authorization; or
- superiority over an established broker.
Answering those questions requires defined hardware, workloads, broker versions, and measurement methods.
Current status and next steps
MetricMQ remains under development. My next checks are:
- test reconnect, acknowledgement, and replay behavior under failure;
- benchmark the global sequence and LMDB write path under contention;
- measure the embedded client on real devices;
- document the threat model for signing and transport security;
- keep protocol documentation and metrics synchronized with the implementation; and
- compare against established brokers using reproducible configurations.
A small executable is interesting. Coherent behavior and repeatable measurements are more important, and that is where the project needs more work.
Source code
MetricMQ repository: github.com/Saptarshi-max/MetricMQ
Demo repository: github.com/Saptarshi-max/MetricMQ-Demo-Scripts