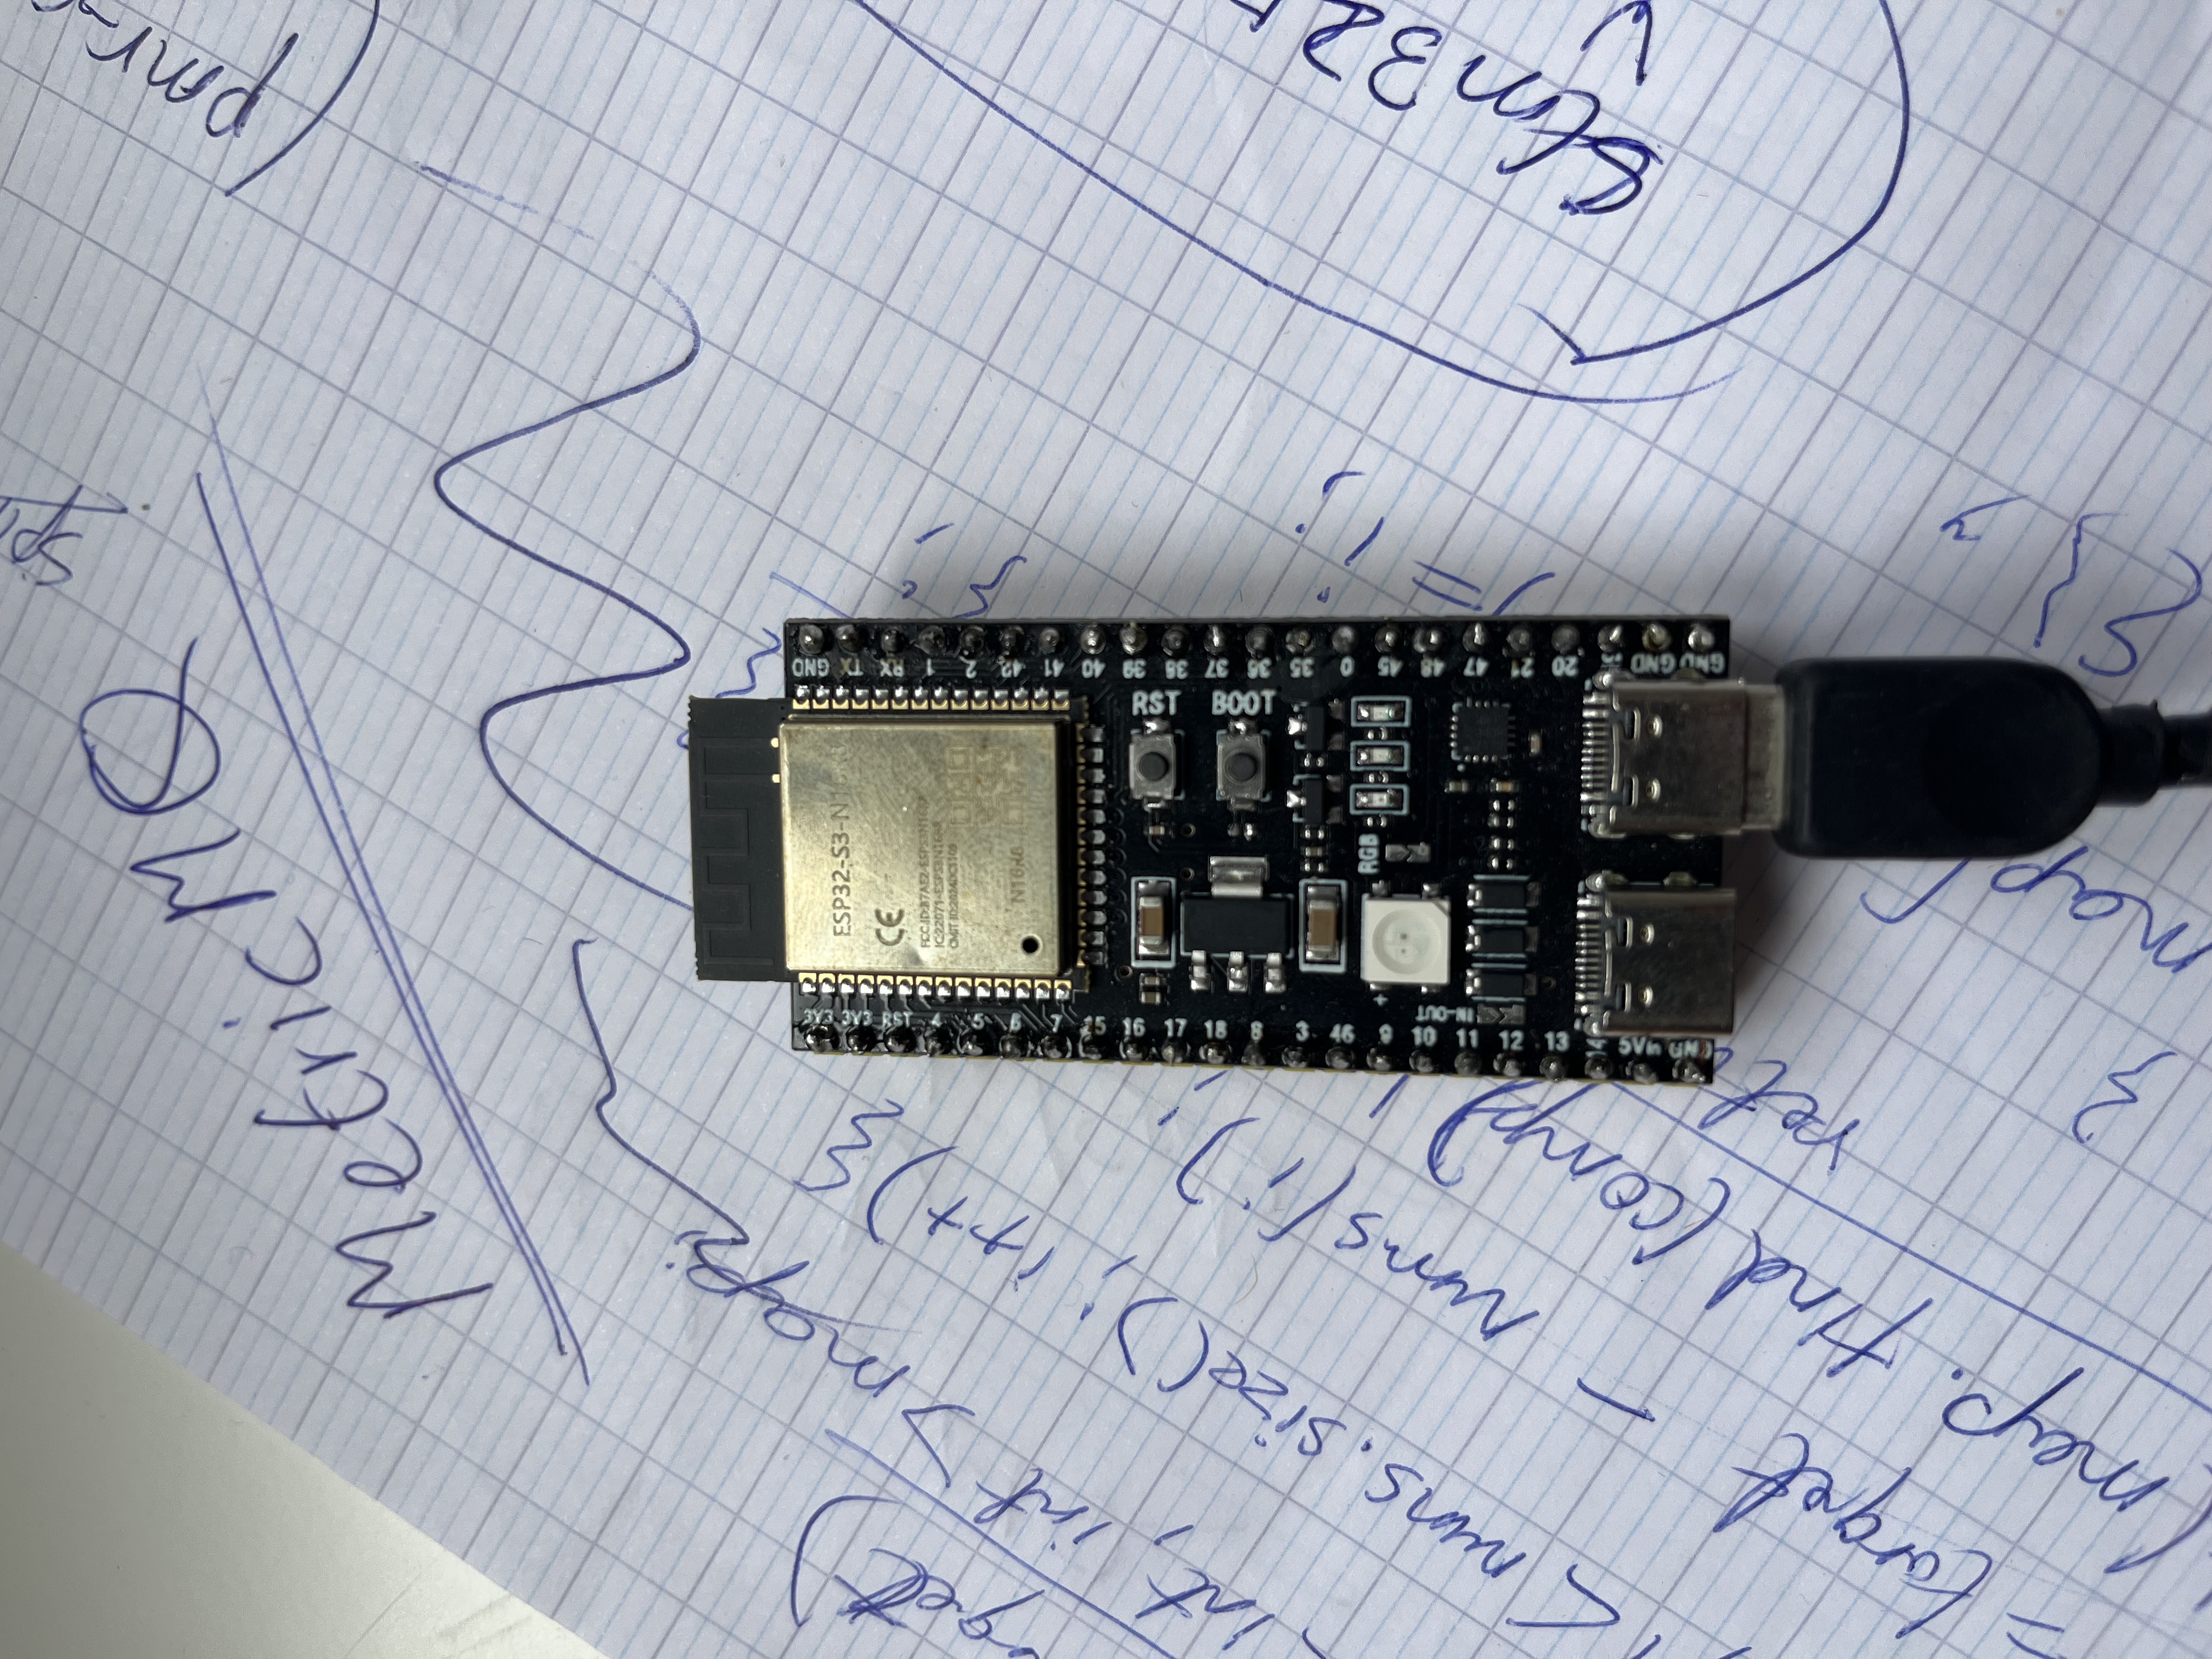
Getting Started with MetricMQ on ESP32
MetricMQ is a 328 KB C++20 message broker built from scratch and still under development. It features a custom binary wire protocol, Ed25519 message signing enforced at the wire level, exactly-once delivery using sequence IDs with LMDB persistence, Prometheus metrics on every message path, and a native ESP32 Arduino client. This page shows the broker running four demos, each highlighting a different capability with live Prometheus metrics you can watch in real time.
Link to the Github Repo
- MetricMQ Github REPO - https://github.com/Saptarshi-max/MetricMQ
- MetricMQ Documenation - https://metricmq-docs.netlify.app/
- MetricMQ My Project Page - https://www.sapnag.me/projects/2025-11-24-metricMQ/
MetricMQ is still in its early beta stage, If you encounter any issues please report it at https://github.com/Saptarshi-max/MetricMQ/issues that will help in making the lib better
Key characteristics:
- 328 KB binary size
- Embedded LMDB storage
- Dual protocol support (RESP + Binary)
- Runs on ESP32/ESP8266 and desktop platforms
- 106K msg/s throughput (measured, 10KB messages)
Features
| Feature | Description |
|---|---|
| Dual Protocol | RESP (Redis-compatible) + Binary Protocol |
| Protocol Detection | Automatic detection on first byte |
| Pub/Sub | Topic-based routing with wildcards |
| Queue Mode | PUSH/PULL with round-robin distribution |
| Exactly-Once Delivery | Sequence IDs with ACK tracking |
| Persistence | LMDB embedded database |
| Metrics | Prometheus endpoint on port 9091 |
| Platforms | Windows, Linux, macOS, ESP32, ESP8266 |
The Demos presented in this Post
[Concepts]  What is pub/sub? Why not just MQTT?
[Setup]     Build the broker on your PC. Verify with redis-cli.
[Demo 1]    Pub/Sub  — ESP32 publishes → PC receives live
[Demo 2]    Exactly-Once — unplug mid-stream → reconnect → missed messages return
[Demo 3]    Fan-Out — one publish → multiple subscribers simultaneously
[Demo 4]    Signed Messages — broker rejects fake data cryptographically
Each demo has its own complete platformio.ini and sketch. Skip to any section independently or work through in order.
What Is a Message Broker?
Already know pub/sub and MQTT? Skip to Setup.
A message broker is a program that sits between devices that produce data (publishers) and devices or services that consume it (subscribers). Think of it like a post office: publishers drop messages off addressed to a topic, the broker sorts and routes them, subscribers collect what matches their subscription.
ESP32 (Publisher)                         PC Terminal (Subscriber)
      │                                           │
      │  publish("sensors/temp", "23.4")          │
      │─────────────► [Broker] ──────────────────►│
      │                                           │
      │                               receives:   │
      │                       "sensors/temp"      │
      │                           "23.4"          │
This pattern — pub/sub — means the ESP32 doesn’t need to know how many things are listening or where they are. It just publishes. New subscribers can join at any time without touching the firmware.
Topics and Wildcards
Topics are strings that work like file paths, using / as a separator:
| Subscription | What it receives |
|---|---|
sensors/temperature |
Only exactly that topic |
sensors/+ |
sensors/temperature, sensors/humidity — any single segment |
sensors/# |
Everything under sensors/ at any depth |
# |
Every single message on the broker |
#
Setting Up the Broker
The broker runs on your PC. Your ESP32 connects to it over your local WiFi. The steps below are verified on Windows 11 with Visual Studio 2022.
What You Need
- Windows: Visual Studio 2022 Community (free) with “Desktop development with C++” workload
- Linux:
sudo apt install build-essential - macOS:
xcode-select --install - CMake 3.20+ — cmake.org/download
- Conan 2.x —
pip install conanthenconan profile detect
Build the Broker
git clone https://github.com/Saptarshi-max/MetricMQ.git
cd MetricMQ
mkdir build
cd build
conan install .. --build=missing -of .
cd ..
cmake -S . -B build -DCMAKE_TOOLCHAIN_FILE="build/conan_toolchain.cmake" -DCMAKE_BUILD_TYPE=Release
cmake --build build --config Release
The first build takes 5–15 minutes while Conan downloads libsodium, LMDB, Boost, spdlog, and Google Benchmark. Subsequent builds use the local cache and are near-instant.
You will see 'pwsh.exe' is not recognized warnings during the build — these are harmless. The CMakeLists.txt has optional post-build scripts that look for PowerShell Core, which is different from standard powershell.exe. They don’t affect any output binaries.
What Gets Built
dir build\Release\*.exe
| Binary | Purpose |
|---|---|
metricmq-broker.exe |
The broker — start this first, always |
metricmq-keygen.exe |
Ed25519 key pair generator (Demo 4) |
binary_pub_only.exe |
Desktop binary publisher for testing |
binary_sub_only.exe |
Desktop binary subscriber for testing |
exactly_once_test.exe |
ACK/replay automated test suite |
signed_publish_test.exe |
Ed25519 crypto test suite |
latency_benchmark.exe |
p50/p99/p99.9 latency measurement |
throughput_benchmark.exe |
msg/s throughput measurement |
Windows Antivirus - Expected False Positive
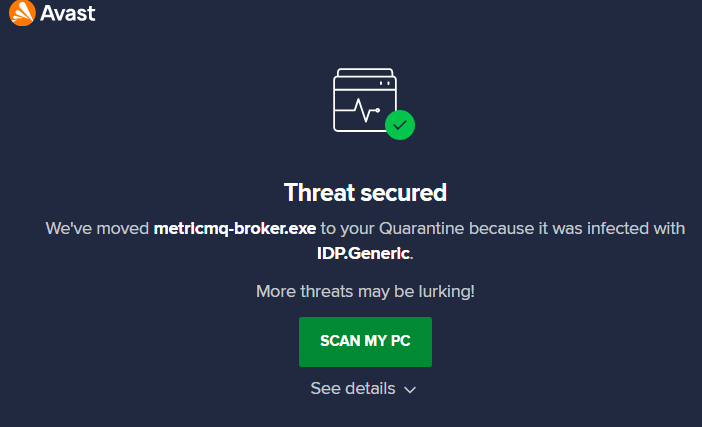
Avast, Defender, and most Windows antivirus tools will quarantine metricmq-broker.exe the first time you run it. This is a false positive — the IDP.Generic detection fires because the binary is unsigned, opens a TCP server socket, and uses a cryptographic library. All three together look suspicious to heuristic scanners even when completely benign.
Fix in Avast: Quarantine → find metricmq-broker.exe → Restore → Menu → Settings → Exceptions → add build\Release\.
Fix in Windows Defender:
Add-MpPreference -ExclusionPath "C:\path\to\MetricMQ\build\Release\"
Start the Broker
.\build\Release\metricmq-broker.exe
Expected output:
MetricMQ Broker v1.0 — Lightweight Message Queue for IoT

Starting broker on port 6379...
Starting metrics server on port 9091...
Press Ctrl+C for graceful shutdown

[info] Metrics server started on http://0.0.0.0:9091/metrics
[info] Broker listening on 0.0.0.0:6379
Broker listening on port 6379
The banner may show garbled Unicode characters on some Windows terminals — cosmetic only, does not affect anything.
Keep this terminal open for all four demos.
Open the Firewall
New-NetFirewallRule -DisplayName "MetricMQ" `
    -Direction Inbound -LocalPort 6379,9091 `
    -Protocol TCP -Action Allow -Profile Any
Install redis-cli and Verify
redis-cli is how you interact with the broker from a terminal — you’ll use it in every demo:
winget install Redis.Redis
Close and reopen PowerShell after installing so the PATH refreshes, then:
redis-cli -p 6379 PING
# Should return: PONG
If you see PONG, the broker is running and reachable. If not, fix this before touching the ESP32 — debugging network problems from a terminal is much easier than from Serial Monitor.
Find Your PC’s IP Address
Your ESP32 sketch needs your PC’s local network IP:
# Windows
ipconfig
# Look for "IPv4 Address" under your WiFi adapter
It will look like 192.168.1.X or 10.0.0.X. Your ESP32 and PC must be on the same WiFi network — same router, same subnet.
Setting Up the ESP32 Library
Installing the Library
Copy the three files from esp32-metricmq/src/ into your PlatformIO project’s lib/MetricMQ/ folder:
your-project/
├── lib/
│   └── MetricMQ/
│       ├── MetricMQ.h
│       ├── MetricMQ.cpp
│       └── library.properties
├── src/
│   └── main.cpp
└── platformio.ini
No lib_deps needed — PlatformIO finds libraries in lib/ automatically.
The platformio.ini for All Demos
[env:4d_systems_esp32s3_gen4_r8n16]
platform = espressif32
board = 4d_systems_esp32s3_gen4_r8n16
framework = arduino
monitor_speed = 115200
monitor_rts = 0
monitor_dtr = 0
build_flags =
    -DCORE_DEBUG_LEVEL=3
monitor_rts = 0andmonitor_dtr = 0prevent the USB CDC disconnect cycle on Windows that causes the Serial Monitor to repeatedly reconnect after flashing. After uploading, wait 3 seconds before opening the monitor:pio run --target upload Start-Sleep -Seconds 3 pio device monitor --port COM8 --baud 115200
The Two-Call Connect Pattern
Every MetricMQ sketch uses the same two-step connect. This is the most important thing to memorise:
// Step 1 — store broker address (does NOT open TCP yet)
client.begin("192.168.1.100", 6379);

// Step 2 — open TCP connection with a stable client ID
// The client ID is how the broker tracks your ACK offset for replay.
// Use the same ID every boot — changing it means starting fresh.
client.connect("my-device-01");
And in every loop():
// The library does NOT auto-reconnect — you must do this
if (!client.isConnected()) {
    client.begin(BROKER_IP, 6379);   // re-set address before reconnecting
    client.connect(CLIENT_ID);
    return;
}

// MUST run every loop() iteration — drives the 60s keep-alive PING
// Long blocking delays will cause the broker to drop the connection
client.loop();
The Callback Signature
When you subscribe to a topic, your callback receives four parameters:
client.subscribe("sensors/#",
    [](const String& topic,    // topic the message arrived on
       const uint8_t* payload, // raw payload bytes
       size_t length,          // payload length
       uint64_t sequence)      // broker-assigned sequence number
    {
        String msg((const char*)payload, length);
        Serial.printf("[MSG] %s → %s (seq=%llu)\n",
                      topic.c_str(), msg.c_str(), sequence);
    }
);
Note: topic is const String&, not const char*. Use .c_str() when you need a raw C string.
Demo 1: Basic Pub/Sub — “Hello, Broker”
What you learn: Publishing from the ESP32, subscribing from your PC, and seeing cross-protocol interop — the ESP32 speaks binary protocol, redis-cli speaks RESP text protocol, the broker routes between them transparently.
Hardware: One ESP32-S3, USB cable, PC running the broker.
src/main.cpp
/*
 * MetricMQ Demo 1 — Basic Pub/Sub
 *
 * ESP32 publishes a simulated temperature reading every 3 seconds.
 * Subscribe on your PC: redis-cli -p 6379 SUBSCRIBE "sensors/#"
 *
 * The interesting part: the ESP32 uses MetricMQ's 16-byte binary protocol.
 * redis-cli uses RESP (Redis text protocol).
 * The broker detects both from the first byte and routes between them.
 * No configuration on either side.
 */

#include <Arduino.h>
#include <WiFi.h>
#include <MetricMQ.h>

const char* WIFI_SSID = "YOUR_WIFI_SSID";
const char* WIFI_PASS = "YOUR_WIFI_PASSWORD";
const char* BROKER_IP = "192.168.1.100";
const char* CLIENT_ID = "esp32-demo1";

MetricMQClient client;
uint32_t msgCount = 0;
uint32_t lastPub  = 0;

void connectWiFi() {
    Serial.printf("[WiFi] Connecting to %s", WIFI_SSID);
    WiFi.begin(WIFI_SSID, WIFI_PASS);
    while (WiFi.status() != WL_CONNECTED) { delay(500); Serial.print("."); }
    Serial.printf("\n[WiFi] Connected: %s\n", WiFi.localIP().toString().c_str());
}

void connectBroker() {
    Serial.printf("[Broker] Connecting as '%s'...\n", CLIENT_ID);
    client.begin(BROKER_IP, 6379);
    client.connect(CLIENT_ID);
    Serial.println(client.isConnected()
                   ? "[Broker] Connected OK"
                   : "[Broker] FAILED — check IP and firewall");
}

void setup() {
    Serial.begin(115200);
    delay(500);
    Serial.println("\n=== MetricMQ Demo 1: Basic Pub/Sub ===");
    connectWiFi();
    connectBroker();
}

void loop() {
    if (!client.isConnected()) {
        delay(2000);
        connectBroker();
        return;
    }
    client.loop();

    if (millis() - lastPub > 3000) {
        lastPub = millis();
        msgCount++;

        float temp = 20.0f + (float)random(-30, 80) / 10.0f;
        char payload[64];
        snprintf(payload, sizeof(payload),
                 "{\"msg\":%u,\"temp\":%.1f}", msgCount, temp);

        client.publish(String("sensors/temperature"), String(payload));
        Serial.printf("[PUB #%u] sensors/temperature → %s\n", msgCount, payload);
    }
}
How to Run It
Flash the sketch. Open Serial Monitor. In a second PC terminal:
redis-cli -p 6379 SUBSCRIBE "sensors/#"
What to Expect
Serial Monitor:
=== MetricMQ Demo 1: Basic Pub/Sub ===
[WiFi] Connected: 192.168.1.10
[MetricMQ] Connected to 192.168.1.100:6379
[MetricMQ] Client ID: esp32-demo1 | Signing: OFF
[Broker] Connected OK
[PUB #1] sensors/temperature → {"msg":1,"temp":23.4}
[PUB #2] sensors/temperature → {"msg":2,"temp":21.1}
PC terminal:
1) "message"
2) "sensors/temperature"
3) "{\"msg\":1,\"temp\":23.4}"
The ESP32 spoke binary protocol. redis-cli spoke RESP. The broker translated automatically.
What the Broker Metrics Show
curl http://localhost:9091/metrics | Select-String "metricmq_messages"
metricmq_messages_published_total   4
metricmq_messages_delivered_total   4
metricmq_active_connections         2
published == delivered — zero routing loss. active_connections = 2 — one binary publisher (ESP32), one RESP subscriber (redis-cli).
Demo 2: Exactly-Once Delivery — Surviving a Network Drop
What you learn: What happens to messages while the device is offline, and how MetricMQ replays them on reconnect with no gaps and no duplicates.
How It Works
Every message in binary protocol mode gets a sequence number assigned by the broker. The broker stores every message to LMDB and tracks each subscriber’s last acknowledged sequence. When you reconnect with the same client_id, the broker replays from last_ack + 1:
Publishes:  seq=1  seq=2  seq=3  seq=4  seq=5  seq=6  seq=7
                              │
                        Device drops              │
                        (offline)         Device reconnects
                                          same client_id
                                          last ACK was seq=3

Broker: "replay seq=4, 5, 6, 7 for this client"

Device receives: seq=4 (REPLAY) seq=5 (REPLAY) seq=6 (LIVE) seq=7 (LIVE)
The client_id is how the broker identifies you on reconnect. Without a stable ID, replay doesn’t happen.
src/main.cpp
/*
 * MetricMQ Demo 2 — Exactly-Once Delivery
 *
 * Subscribes with a stable client_id. Tracks sequence numbers.
 * On reconnect, the broker replays any messages that arrived while offline.
 *
 * How to test:
 *   1. Flash and open Serial Monitor
 *   2. Start publishing from PC (command in comment below)
 *   3. While messages 5-10 are publishing, press RST or pull USB
 *   4. Reconnect after 5 seconds — watch the REPLAY labels
 *   5. Total == 20, Duplicates == 0 confirms exactly-once held
 *
 * PC publisher:
 *   Windows: 1..20 | ForEach-Object { redis-cli -p 6379 PUBLISH sensors/temperature "{`"reading`":$_}"; Start-Sleep 1 }
 *   Linux:   for i in $(seq 1 20); do redis-cli -p 6379 PUBLISH sensors/temperature "{\"reading\":$i}"; sleep 1; done
 */

#include <Arduino.h>
#include <WiFi.h>
#include <MetricMQ.h>

const char* WIFI_SSID = "YOUR_WIFI_SSID";
const char* WIFI_PASS = "YOUR_WIFI_PASSWORD";
const char* BROKER_IP = "192.168.1.100";
const char* CLIENT_ID = "esp32-demo2-sub";  // MUST be stable across reboots

MetricMQClient client;
uint32_t totalReceived = 0;
uint32_t duplicates    = 0;
uint64_t lastSeq       = 0;
bool     wasOffline    = false;

void onMessage(const String& topic,
               const uint8_t* payload, size_t length,
               uint64_t sequence) {
    totalReceived++;

    if (sequence <= lastSeq && lastSeq != 0) {
        duplicates++;
        Serial.printf("[!!DUPE] seq=%llu (expected > %llu)\n", sequence, lastSeq);
    } else {
        const char* label = wasOffline ? "REPLAY" : "LIVE  ";
        lastSeq = sequence;
        String msg((const char*)payload, length);
        Serial.printf("[%s] seq=%-4llu | %s\n", label, sequence, msg.c_str());
    }

    Serial.printf("         Total: %u | Duplicates: %u\n",
                  totalReceived, duplicates);
}

void connectAndSubscribe() {
    Serial.printf("[Broker] Connecting as '%s' (last seq=%llu)...\n",
                  CLIENT_ID, lastSeq);
    client.begin(BROKER_IP, 6379);
    client.connect(CLIENT_ID);

    if (client.isConnected()) {
        Serial.println("[Broker] Connected — broker will replay missed messages");
        client.subscribe("sensors/temperature", onMessage);
        wasOffline = false;
    } else {
        Serial.println("[Broker] FAILED");
    }
}

void setup() {
    Serial.begin(115200);
    delay(500);
    Serial.println("\n=== MetricMQ Demo 2: Exactly-Once Delivery ===");
    Serial.println("Pull USB or press RST while messages are publishing.\n");

    WiFi.begin(WIFI_SSID, WIFI_PASS);
    while (WiFi.status() != WL_CONNECTED) { delay(500); Serial.print("."); }
    Serial.printf("\n[WiFi] %s\n", WiFi.localIP().toString().c_str());

    connectAndSubscribe();
}

void loop() {
    if (!client.isConnected()) {
        wasOffline = true;
        Serial.printf("\n[Broker] Disconnected at seq=%llu — reconnecting...\n",
                      lastSeq);
        delay(2000);
        connectAndSubscribe();
        return;
    }
    client.loop();
}
What to Expect
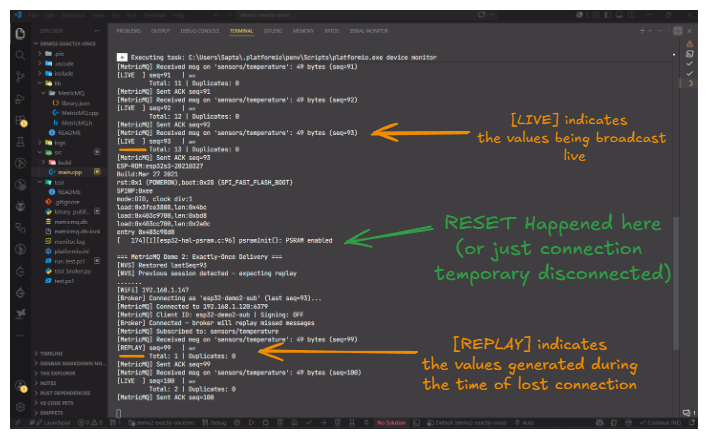
[LIVE  ] seq=1    | {"reading":1}
         Total: 1 | Duplicates: 0
[LIVE  ] seq=4    | {"reading":4}
         Total: 4 | Duplicates: 0

--- RST pressed here ---

[Broker] Disconnected at seq=4 — reconnecting...
[Broker] Connected — broker will replay missed messages
[REPLAY] seq=5    | {"reading":5}
[REPLAY] seq=6    | {"reading":6}
[REPLAY] seq=7    | {"reading":7}
[LIVE  ] seq=8    | {"reading":8}
...
         Total: 20 | Duplicates: 0
The ScreenShot, of the Platformio Serial Terminal :
What the Broker Metrics Show
# While device is offline:
metricmq_ack_tracking_efficiency    62   ← drops during outage — expected
metricmq_lmdb_stored_messages       8    ← broker kept storing

# After reconnect and replay:
metricmq_ack_tracking_efficiency    100  ← restored after replay ACKs
metricmq_replay_messages_total      4    ← exactly how many were recovered
ack_tracking_efficiency returning to 100 after reconnect is the broker confirming the replay worked and everything was acknowledged.
Replay window: The broker retains the last 100,000 messages in LMDB. At 1 message/second that’s 27 hours of replay coverage — more than enough for typical WiFi outages.
Demo 3: Fan-Out with Wildcards — One Publish, Many Subscribers
What you learn: How one ESP32 publishing to a topic can be received by multiple subscribers simultaneously using wildcard patterns, with no firmware changes.
src/main.cpp
/*
 * MetricMQ Demo 3 — Fan-Out with Wildcards
 *
 * Publishes temperature, humidity, and CO2 to three subtopics every 5 seconds.
 *
 * Open three PC terminals and run:
 *   Terminal A: redis-cli -p 6379 SUBSCRIBE "sensors/env/temperature"
 *   Terminal B: redis-cli -p 6379 SUBSCRIBE "sensors/env/+"
 *   Terminal C: redis-cli -p 6379 SUBSCRIBE "sensors/#"
 *
 * A gets 1 message/cycle. B and C each get 3.
 * The publisher never changes — just add more subscribers.
 */

#include <Arduino.h>
#include <WiFi.h>
#include <MetricMQ.h>

const char* WIFI_SSID = "YOUR_WIFI_SSID";
const char* WIFI_PASS = "YOUR_WIFI_PASSWORD";
const char* BROKER_IP = "192.168.1.100";
const char* CLIENT_ID = "esp32-demo3";

MetricMQClient client;
uint32_t cycle  = 0;
uint32_t lastPub = 0;

void setup() {
    Serial.begin(115200);
    delay(500);
    Serial.println("\n=== MetricMQ Demo 3: Fan-Out with Wildcards ===");
    Serial.println("Open 3 PC terminals (commands in sketch comment).\n");

    WiFi.begin(WIFI_SSID, WIFI_PASS);
    while (WiFi.status() != WL_CONNECTED) { delay(500); Serial.print("."); }
    Serial.printf("[WiFi] %s\n", WiFi.localIP().toString().c_str());

    client.begin(BROKER_IP, 6379);
    client.connect(CLIENT_ID);
    Serial.println(client.isConnected() ? "[Broker] Connected" : "[Broker] FAILED");
}

void loop() {
    if (!client.isConnected()) {
        delay(2000);
        client.begin(BROKER_IP, 6379);
        client.connect(CLIENT_ID);
        return;
    }
    client.loop();

    if (millis() - lastPub > 5000) {
        lastPub = millis();
        cycle++;

        float temp = 21.0f + (float)random(-20, 50) / 10.0f;
        float hum  = 45.0f + (float)random(-100, 200) / 10.0f;
        int   co2  = 400 + random(0, 600);

        client.publish("sensors/env/temperature", String(temp, 1));
        client.publish("sensors/env/humidity",    String(hum, 1));
        client.publish("sensors/env/co2",         String(co2));

        Serial.printf("[Cycle %u] temp=%.1f°C  hum=%.1f%%  co2=%d ppm\n",
                      cycle, temp, hum, co2);
    }
}
What to Expect
Terminal A (exact):   1 message/cycle  (temperature only)
Terminal B (+ wild):  3 messages/cycle (temp + hum + co2)
Terminal C (# wild):  3 messages/cycle (everything under sensors/)
Check the fan-out multiplier live:
(Invoke-WebRequest http://localhost:9091/metrics).Content |
    Select-String "delivered|published"
metricmq_messages_published_total   9    ← 3 topics × 3 cycles
metricmq_messages_delivered_total   21   ← A(3) + B(9) + C(9)
Fan-out ratio = 21 / 9 = 2.33. Add a fourth subscriber and watch it climb to ~3.0 without touching the sketch.
Demo 4: Signed Messages — Proving Your Data Is Real
What you learn: Ed25519 message signing on the device. The broker verifies the signature before routing. Unsigned messages to secure/ topics are rejected at the wire level.
Why This Matters
Your ESP32 publishes {"temp":23.4}. Someone on the same WiFi publishes {"temp":-99} to the same topic. Both look identical to your backend. Ed25519 signing closes this gap: your device signs every message with a private key (64 bytes, never transmitted). The broker has the corresponding public key and verifies before routing. A message without a valid signature never reaches any subscriber.
This is authentication, not encryption. The payload is still visible on the wire. Signing proves who sent it and that it wasn’t modified.
Step 1: Generate a Key Pair
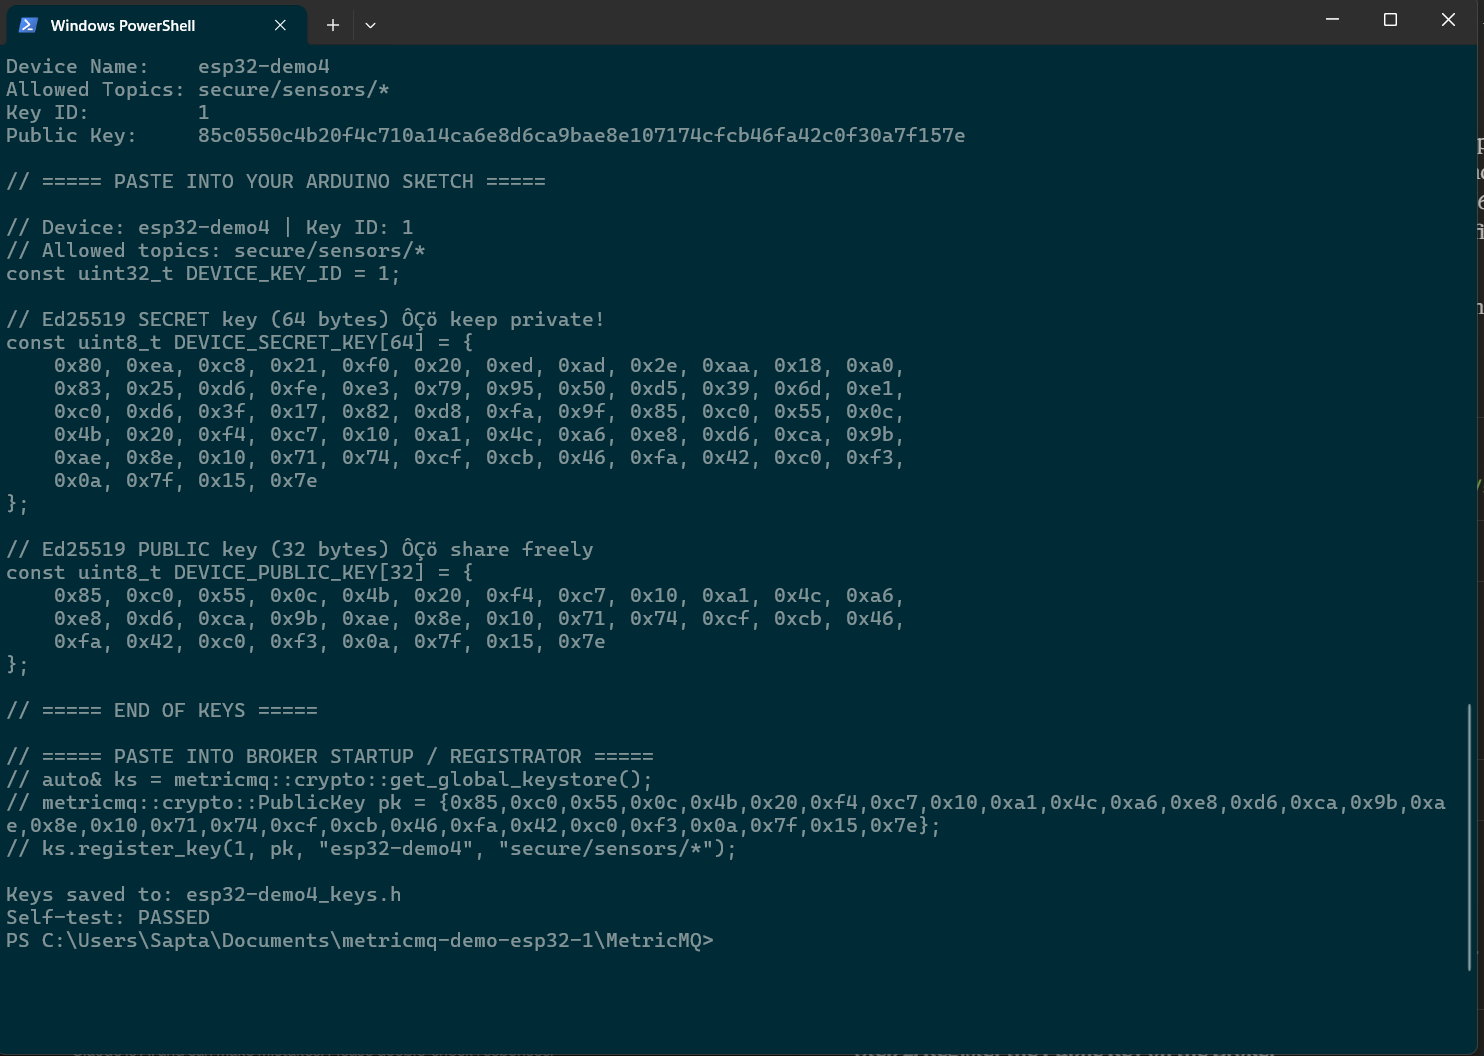
.\build\Release\metricmq-keygen.exe "esp32-demo4" "secure/sensors/*"
Output:
Secret key (64 bytes) — device only, never share:
  { 0x4a, 0x3f, ... }

Public key (32 bytes) — register on broker:
  { 0x8c, 0x1d, ... }
The screenshot on your terminal:
Create include/device_secrets.h (add to .gitignore):
// include/device_secrets.h — NEVER commit this file
#pragma once
static const uint8_t SECRET_KEY[64] = { 0x4a, 0x3f, /* ... 64 bytes */ };
static const uint32_t KEY_ID = 1;
Step 2: Register the Public Key on the Broker
In MetricMQ/src/main.cpp, add before broker.run():
uint8_t pk[32] = { 0x8c, 0x1d, /* ... 32 bytes */ };
broker.get_keystore().register_key(1, pk, {"secure/sensors/*"});
Rebuild and restart:
cmake --build build --config Release
.\build\Release\metricmq-broker.exe
src/main.cpp
/*
 * MetricMQ Demo 4 — Ed25519 Signed Messages
 *
 * Prerequisites (complete before flashing):
 *   1. Run metricmq-keygen "esp32-demo4" "secure/sensors/*"
 *   2. Paste secret key into include/device_secrets.h (in .gitignore)
 *   3. Register public key in broker src/main.cpp, rebuild, restart broker
 *
 * To test:
 *   Subscriber: redis-cli -p 6379 SUBSCRIBE "secure/sensors/#"
 *   Spoof:      redis-cli -p 6379 PUBLISH secure/sensors/temperature '{"fake":true}'
 *               → broker prints SIGNATURE_REQUIRED, subscriber gets NOTHING
 */

#include <Arduino.h>
#include <WiFi.h>
#include <MetricMQ.h>
#include "device_secrets.h"

const char* WIFI_SSID = "YOUR_WIFI_SSID";
const char* WIFI_PASS = "YOUR_WIFI_PASSWORD";
const char* BROKER_IP = "192.168.1.100";
const char* CLIENT_ID = "esp32-demo4";

MetricMQClient client;
uint32_t msgCount = 0;
uint32_t lastPub  = 0;

void connectBroker() {
    // setSigningKey MUST come before begin()/connect()
    client.setSigningKey(SECRET_KEY, KEY_ID);
    Serial.printf("[Broker] Connecting in signed mode (key_id=%u)...\n", KEY_ID);
    client.begin(BROKER_IP, 6379);
    client.connect(CLIENT_ID);
    Serial.println(client.isConnected()
                   ? "[Broker] Connected — signed mode active"
                   : "[Broker] FAILED");
}

void setup() {
    Serial.begin(115200);
    delay(500);
    Serial.println("\n=== MetricMQ Demo 4: Signed Messages ===");

    WiFi.begin(WIFI_SSID, WIFI_PASS);
    while (WiFi.status() != WL_CONNECTED) { delay(500); Serial.print("."); }
    Serial.printf("[WiFi] %s\n", WiFi.localIP().toString().c_str());

    connectBroker();
}

void loop() {
    if (!client.isConnected()) {
        delay(2000);
        connectBroker();
        return;
    }
    client.loop();

    if (millis() - lastPub > 5000) {
        lastPub = millis();
        msgCount++;

        float temp = 22.5f + (float)random(-30, 30) / 10.0f;
        char payload[96];
        snprintf(payload, sizeof(payload),
                 "{\"msg\":%u,\"temp\":%.1f,\"device\":\"%s\"}",
                 msgCount, temp, CLIENT_ID);

        client.publishSigned(String("secure/sensors/temperature"),
                             String(payload));
        Serial.printf("[SIGNED #%u] %s\n", msgCount, payload);
    }
}
What to Expect
Broker console after a legitimate signed message:
[info] Key 1 verified OK — routing secure/sensors/temperature
After the spoof attempt:
[warn] SIGNATURE_REQUIRED — rejecting unsigned publish on secure/sensors/temperature
The subscriber receives nothing from the spoof.
What the Broker Metrics Show
metricmq_signature_verifications_total   8    ← legitimate signed messages
metricmq_signature_failures_total        1    ← the rejected spoof
signature_failures_total should be 0 in a healthy deployment. Any non-zero value means either a device has a corrupted key or someone is probing your broker with unsigned frames.
Prometheus + Grafana: Seeing Your System Live
This is the part most tutorials skip. The broker exposes live metrics on port 9091 from the moment it starts — you don’t enable anything extra. Here’s why it matters and how to use it.
What Value Does This Actually Serve?
Without observability, your IoT system is a black box. You know the broker process is running, but you don’t know:
- How many devices are currently connected?
- Are messages actually being delivered, or silently dropped?
- Has any device been offline long enough to risk losing data?
- Did someone just inject fake sensor data?
- Is the broker getting slower under load?
Prometheus collects these numbers continuously. Grafana makes them visible. Together they answer all five questions in real time without SSH’ing into anything.
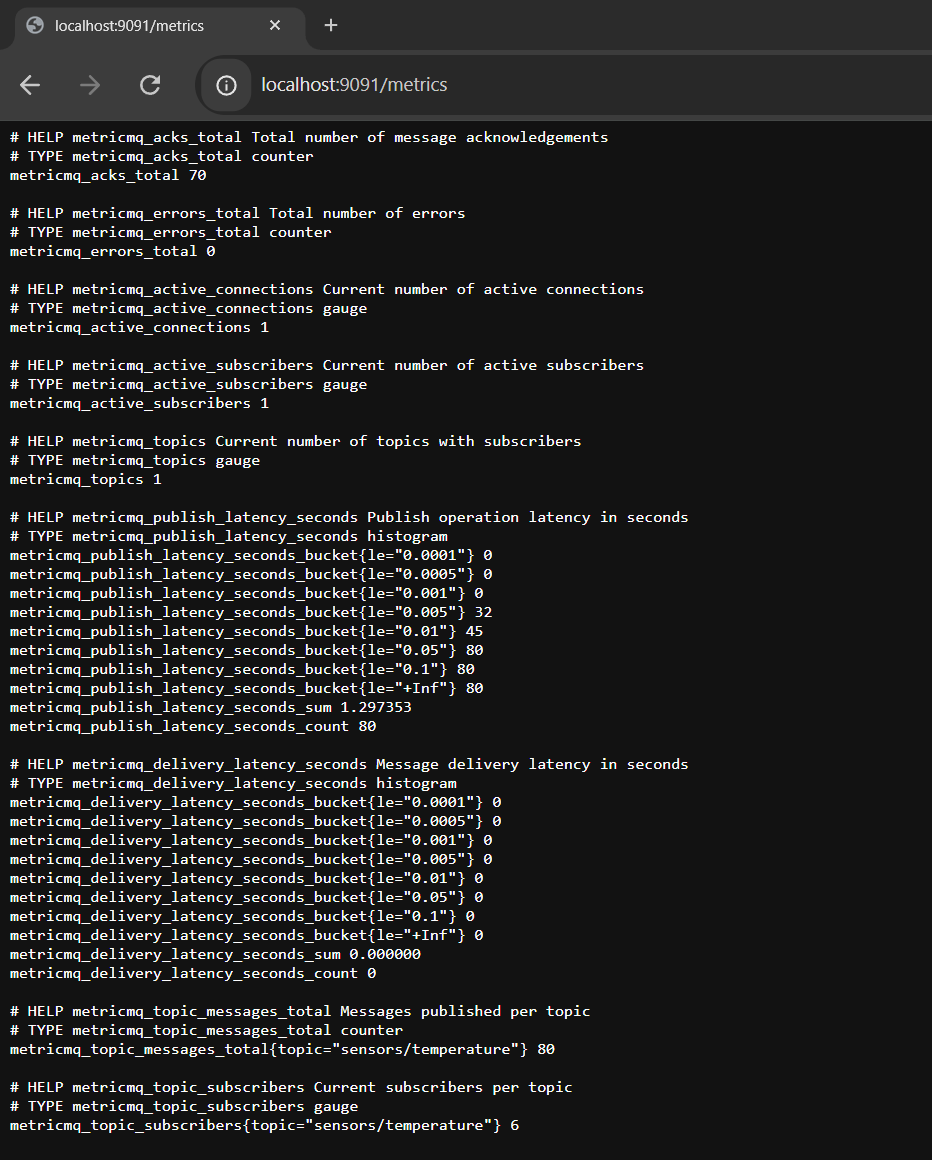
The Prometheus data (raw format) in the browser, Open up http://localhost:9091/metrics in your broswer when the broker is running: (ScreenShot Below)
The Metrics That Matter
# One-shot snapshot
(Invoke-WebRequest http://localhost:9091/metrics).Content |
    Select-String "^metricmq_"

# Live view, refreshes every 2 seconds
while ($true) {
    Clear-Host
    (Invoke-WebRequest http://localhost:9091/metrics -UseBasicParsing).Content `
        -split "`n" | Where-Object { $_ -match "^metricmq_" -and $_ -notmatch "^#" }
    Start-Sleep 2
}
| Metric | What it tells you |
|---|---|
metricmq_active_connections |
How many clients are connected right now |
metricmq_messages_published_total |
Total publishes the broker accepted |
metricmq_messages_delivered_total |
Total deliveries that reached a subscriber |
metricmq_ack_tracking_efficiency |
% of binary messages ACKed — target: ~100 |
metricmq_replay_messages_total |
Messages replayed from LMDB after reconnects |
metricmq_publish_latency_microseconds |
p50/p99/p99.9 routing latency |
metricmq_signature_verifications_total |
Successful Ed25519 verifications |
metricmq_signature_failures_total |
Rejected/unsigned frames — target: 0 |
metricmq_lmdb_stored_messages |
Messages currently persisted in LMDB |
Setting Up Prometheus (10 Minutes)
Note: Prometheus is not available via
winget— it is distributed as a zip archive from the official GitHub releases page. The commands below download, extract, and configure it in one go.
Step 1: Download and extract Prometheus:
# Run this in PowerShell — downloads Prometheus and extracts to C:\prometheus
$version = "3.4.0"
$url     = "https://github.com/prometheus/prometheus/releases/download/" +
           "v$version/prometheus-$version.windows-amd64.zip"

Invoke-WebRequest -Uri $url -OutFile "$env:TEMP\prometheus.zip"
Expand-Archive -Path "$env:TEMP\prometheus.zip" `
               -DestinationPath "C:\prometheus" -Force

Write-Host "Prometheus extracted to C:\prometheus"
Step 2: Create C:\prometheus\prometheus.yml — open Notepad and save
this content to that path:
global:
  scrape_interval: 5s

scrape_configs:
  - job_name: metricmq
    static_configs:
      - targets: ['localhost:9091']
Step 3: Start Prometheus (keep this terminal open):
# Navigate into the extracted folder and start
$version = "3.4.0"
cd "C:\prometheus\prometheus-$version.windows-amd64"
.\prometheus.exe --config.file="..\prometheus.yml"
You should see:
ts=... level=info msg="Server is ready to receive web requests."
Step 4: Open http://localhost:9090 in your browser. Type
metricmq_messages_published_total in the query box and press Enter.
You should see data points immediately if the broker is running.
If you see “No data”, check that the broker is running and that port 9091
is reachable: curl http://localhost:9091/metrics should return metric lines.
Setting Up Grafana (10 More Minutes)
Note:
winget install GrafanaLabs.Grafanadoes not exist. Use the official MSI installer below.
Step 1: Download and install Grafana:
# Downloads the Grafana MSI and installs it as a Windows service
$grafanaVersion = "12.0.1"
$url = "https://dl.grafana.com/oss/release/grafana-$grafanaVersion.windows-amd64.msi"

Invoke-WebRequest -Uri $url -OutFile "$env:TEMP\grafana.msi"
Start-Process msiexec -ArgumentList "/i $env:TEMP\grafana.msi /quiet" -Wait

Write-Host "Grafana installed. Starting service..."
Start-Service -Name "Grafana"
Grafana installs as a Windows service and starts automatically. If the
service doesn’t start automatically, run Start-Service -Name "Grafana"
from an elevated PowerShell window.
Step 2: Open http://localhost:3000 in your browser.
Default login: admin / admin. Grafana will ask you to set a new password
on first login — do that and continue.
Step 3: Add Prometheus as a data source:
- Left sidebar → Connections → Data Sources → Add data source
- Select Prometheus
- URL:
http://localhost:9090 - Click Save & Test — you should see “Data source is working”
Step 4: Create a new dashboard with four panels:
- Top right → New Dashboard → Add visualization
- For each panel: paste the PromQL query, set the panel type, set the title
Panel 1 — Message Rate
PromQL: rate(metricmq_messages_published_total[1m])
Type: Time series | Shows: messages per second live

Panel 2 — Delivery Efficiency
PromQL: metricmq_messages_delivered_total / metricmq_messages_published_total
Type: Stat | Alert if: < 0.95

Panel 3 — ACK Tracking
PromQL: metricmq_ack_tracking_efficiency
Type: Gauge | Alert if: < 95 for > 60s

Panel 4 — Security Events
PromQL: increase(metricmq_signature_failures_total[5m])
Type: Stat | Alert if: > 0
What Each Alert Catches in a Real Deployment
delivery efficiency drops below 0.95: Some messages are not reaching subscribers. Could be a crashed consumer, a network partition, or a topic mismatch. In a building automation system with five consumers on a temperature stream, this dropping from 1.0 to 0.6 means three consumers silently went offline.
ack_tracking_efficiency drops below 95 for more than 60 seconds: A subscriber is falling behind - WiFi instability, device overload, or a bug in the application layer consuming messages too slowly. This fires before any data is actually lost.
signature_failures_total increments: Either a device has a corrupted key after a failed OTA update, or someone on the network is probing the broker with unsigned frames. This is your intrusion detection in a single counter — one alert rule covers the entire fleet.
lmdb_stored_messages grows without replay_messages_total growing: Messages are accumulating in LMDB but no subscriber is claiming them. A device has been permanently offline. At 100,000 stored messages the broker starts compacting and the oldest readings are lost. This gives you advance warning.
How to Navigate the MetricMQ Docs
The official docs live at metricmq-docs.netlify.app. Here’s how to use them efficiently depending on what you’re trying to do.
If You’re Just Getting Started
Start with the Quick Start — ESP32 section on the main page. It shows the minimal setup() and loop() pattern. Then come back to this blog post for the full working sketches — the docs show the pattern, the demos here show the complete code.
If You Want to Understand the Wire Protocol
The Wire Protocol table on the main page defines the exact 16-byte header layout:
Offset 0    : version (0x01)
Offset 1    : command byte
Offset 2–3  : topic length  (uint16 big-endian)
Offset 4–7  : payload length (uint32 big-endian)
Offset 8–15 : sequence number (uint64 big-endian)
Offset 16+  : topic bytes, then payload bytes
This is the ground truth for anyone implementing a client on a new platform. If you’re writing a client for STM32, Raspberry Pi, or any other platform, this table plus the BinaryCommand enum values (SUBSCRIBE=0x01, PUBLISH=0x03, MESSAGE=0x04, etc.) is everything you need.
If You’re Integrating MetricMQ Into an Existing Project
For ESP32/Arduino: Copy the three files from esp32-metricmq/src/ into your project’s lib/MetricMQ/ folder. That’s the complete integration — no package manager, no CMake, no external dependencies beyond arduino-esp32 v2.0.0+ which ships libsodium. Your existing WiFi code, sensor reads, and display code stay exactly as they are. MetricMQ adds three things: begin() + connect() in setup(), client.loop() in loop(), and client.publish() wherever you currently Serial.printf() your data.
For native C++: Include metricmq/pubsub.hpp for RESP or metricmq/binary_pubsub.hpp for the binary protocol. The BinaryPublisher class handles frame construction and Ed25519 signing. The BinarySubscriber handles ACK tracking and replay. Add metricmq as a Conan dependency to your existing conanfile.txt.
If You’re Evaluating for a Production Deployment
Read the Production Risks table on the main page before anything else. The most important entries are: the single global mutex (limits concurrency above ~500 clients), no RESP authentication (any TCP client on port 6379 has full access), no session idle timeout (crashed clients leave zombie threads), and LMDB filling to 1 GB with no compaction or TTL. These are real constraints — understand them before deciding if MetricMQ is the right tool for your scale.
If You’re Running Tests
The Running Tests section on the main page lists every test binary and whether it needs a live broker. Start with signed_publish_test — it needs no broker and confirms your Ed25519 setup is correct. Then exactly_once_test with the broker running to confirm ACK tracking and replay. The persistence_test is the most useful for Demo 2 validation.