Controlling and Automating Measurement Equipment for Hardware Testing Using Python
Good measurement is extremely essential in testing, because acquired data drives key engineering decisions. While engineers prefer automated testing to minimise human error and accelerate the process of data acquisition. But automated testing is not all about running scripts on a loop. If not checked, automated testing can introduce incorrect conclusions and poor engineering decisions
- Introduction – Manual Testing Is Painful, but Bad Measurements Are Worse
- Measurement Fundamentals for Embedded Systems
- Why Python for Embedded Testing?
- The SCPI Commands and IEEE Standardisations for Measurement Equipments
- Reading the Datasheet & Reference Manual, Before You Touch Python
- Building Your First Automated Measurement
- Level Up: Power Consumption Testing
- Real-World Applications
- When Things Go Wrong
- Testing the Tests – PyVISA Mocks & Simulation
- Debugging Automated Measurements
- Designing Automation‑Friendly Embedded Tests (Not Just Scripts)
- References
Introduction – Manual Testing Is Painful, but Bad Measurements Are Worse
Prolonged Manual testing can be extremely time consuming & prone to errors, You probe voltages for hours, copy numbers into Excel, and then that one weird reading or a series of bad readings after hours of data acqusition … leaving you with one question in your mind! Could this be a measurement error or a loose probe … has there been similar corrupt data which accidently got recorded in the log files??”.
PyVISA fixes this. Write Python code once, run it overnight. Same SCPI commands you’d type on the instrument, but repeatable. The script doesn’t forget to log data or accidentally change the range mid-test.
But, automation makes mistakes bigger. Bad config = bad data everywhere.
In this blog post, I want to share practical tips and techniques for automating measurement equipment using PyVISA, covering everything from connecting instruments to handling errors and testing without hardware.
connect instruments → send SCPI commands → save data → handle errors → test without hardware.
Measurement Fundamentals for Embedded Systems
Automating a bad test setup just gives you bad data faster. What matters:
Accuracy vs Precision: Accurate = close to truth. Precise = repeatable. You need both. A DMM reading 4.80V repeatedly on a 5V rail is precise but wrong.
Settings that actually matter:
- Range: Auto-range is convenient but slow and adds jitter. Fix it.
- Resolution: 6.5 digits sounds impressive until you realize your DUT has ±5% tolerance.
- Triggering: Know when your instrument actually takes the measurement.
Common traps:
- Automating before validating manually (garbage in, garbage out at scale)
- Forgetting warm-up (cold instruments drift)
- Trusting out-of-calibration equipment
Why Python for Embedded Testing?
LabVIEW costs $5,000+ per seat and proprietary tools lock you into specific hardware vendors. MATLAB is fine but Python is free, runs everywhere, and has a mature ecosystem that hardware engineers already use for data analysis.
Python gives you:
- Readable code that doesn’t require a manual to understand 6 months later
- Pandas/Matplotlib for analysis (beat Excel’s 1M row limit easily) - In automated data acquisition experiments might run for hours/days the 1M row limit is a barrier.
- Free ecosystem (no license servers, no dongles)
- Real programming with proper version control, CI/CD, and debugging tools
Here’s the entire “hello world” for instrument control:
import pyvisa
rm = pyvisa.ResourceManager()
inst = rm.open_resource('USB0::0x1234::INSTR')
print(inst.query('*IDN?'))  # "Who are you?"
That’s it. No init blocks, no state machines, no wires.
The SCPI Commands and IEEE Standardisations for Measurement Equipments
SCPI (Standard Commands for Programmable Instruments) is the ASCII-based command language that all modern test equipment speaks. Think of it as the universal protocol that lets your Python scripts talk to oscilloscopes, multimeters, power supplies, and signal generators.
IEEE 488.2 connection: SCPI builds on the IEEE 488.2 standard, which defines how instruments communicate over interfaces like GPIB, USB, and Ethernet. IEEE 488.2 handles the physical connection and message structure, while SCPI defines the actual commands (*IDN?, VOLT 3.3, etc.). Together, they ensure the same commands work across different manufacturers.
Same SCPI command works on Keysight, Tektronix, Rohde & Schwarz—no vendor-specific nonsense.
SCPI Command Structure
- Commands end with nothing:
CONF:VOLT:DC 10,0.001 - Queries end with
?:*IDN?,READ? - Parameters separated by commas:
10,0.001(range, resolution)
# Same SCPI command works on Keysight, Rohde & Schwarz, Tektronix, etc.
instrument.query('*IDN?')  # Returns: "Keysight Technologies,DMM,123456,1.0"
instrument.write('CONF:VOLT:DC 10,0.001')  # Configure for 10V DC, 1mV resolution
reading = instrument.query('READ?')  # Get measurement
Most buttons on the front panel have SCPI equivalents. Check the programming manual.
For a practical introduction to SCPI commands on real instruments:
SCPI Command Testing & Responses on Real Instruments (YouTube tutorials from manufacturers)
Measurement System Architecture
graph TB
    subgraph Control["Control Layer"]
        PC[Control PC/Python Script]
    end

    subgraph Interface["Interface Layer"]
        VISA[VISA Resource Manager]
        USB[USB Interface]
        LAN[LAN/Ethernet]
        GPIB[GPIB Interface]
    end

    subgraph Instruments
        OSC[Oscilloscope]
        DMM[Digital Multimeter]
        PSU[Power Supply]
        SIG[Signal Generator]
    end

    subgraph DUT_Layer["DUT Layer"]
        DUT[Device Under Test]
        PROBE[Probes & Cables]
    end

    PC --> VISA
    VISA --> USB
    VISA --> LAN
    VISA --> GPIB

    USB --> OSC
    USB --> DMM
    LAN --> PSU
    GPIB --> SIG

    OSC --> PROBE
    DMM --> PROBE
    PSU --> DUT
    SIG --> DUT
    PROBE --> DUT

    style PC fill:#90EE90
    style VISA fill:#87CEEB
    style DUT fill:#FFB6C1
Physical connection:
Your PC runs Python + PyVISA → VISA handles USB/LAN/GPIB → Instruments respond to SCPI → Instruments measure your DUT
Reading the Datasheet & Reference Manual, Before You Touch Python
Read your instrument’s programming manual first. Seriously. Don’t skip this.
What to Look For
- Command Reference: List of all SCPI commands with examples
- Connection Methods: USB, LAN, GPIB addresses
- Error Codes: What the numbers mean when things go wrong
- Timing Requirements: How long commands take to execute
Manufacturer Resources
- Keysight: Search “programming manual” on keysight.com
- Tektronix: Look for “programmer manual” on tek.com
- Rohde & Schwarz: Check “remote control manual”
Commands vary by firmware version. Check yours against the manual.
Building Your First Automated Measurement
Let’s build a complete voltage measurement script from scratch. You’ll see exactly what happens at each step—no mysteries.
What We’re Building
A script that:
- Connects to a multimeter (DMM)
- Takes 5 voltage readings
- Saves data to CSV
- Creates a simple chart
Real output you’ll get:
Connected to: Keysight Technologies,34461A,MY12345678,A.02.14-02.40-02.14-00.49-03-01
Reading 1: 3.287 V
Reading 2: 3.289 V
Reading 3: 3.288 V
Reading 4: 3.290 V
Reading 5: 3.287 V
Data saved to voltage_measurements.csv
Step 1: Install the Tools
Open your terminal and run:
pip install pyvisa pyvisa-py pandas matplotlib
What each does:
pyvisa- talks to instrumentspyvisa-py- pure Python backend (no VISA libraries needed)pandas- organizes data into tablesmatplotlib- creates charts
Step 2: Find Your Instrument
Plug in your multimeter via USB. Run this to see if Python can find it:
import pyvisa

rm = pyvisa.ResourceManager()
instruments = rm.list_resources()
print("Found instruments:", instruments)
What you’ll see:
Found instruments: ('USB0::0x2A8D::0x0101::MY12345678::INSTR',)
That weird string? That’s your instrument’s address. Copy it—you’ll need it next.
Can’t find anything? Check if your instrument is powered on and the USB cable is connected. Some instruments need drivers—check the manufacturer’s website.
Step 3: Make Your First Measurement
Now let’s actually talk to the instrument. Replace the address with yours from Step 2:
import pyvisa

rm = pyvisa.ResourceManager()

# Replace this address with yours!
instrument_address = 'USB0::0x2A8D::0x0101::MY12345678::INSTR'

with rm.open_resource(instrument_address) as inst:
    # Ask who it is
    idn = inst.query('*IDN?')
    print(f"Connected to: {idn}")

    # Configure for DC voltage measurement
    # 10V range, 1mV resolution
    inst.write('CONF:VOLT:DC 10,0.001')

    # Take one measurement
    voltage = float(inst.query('READ?'))
    print(f"Measured voltage: {voltage:.3f} V")
What’s happening here:
open_resource()- opens connection to the DMMquery('*IDN?')- asks “who are you?” (standard SCPI command)write('CONF:VOLT:DC 10,0.001')- sets up voltage measurementquery('READ?')- takes a reading and returns it
Run it. You should see the voltage on whatever you’re probing.
Step 4: Take Multiple Readings and Save Data
Now let’s collect 5 readings and save them. This is where automation starts helping:
import pyvisa
import pandas as pd
from datetime import datetime

rm = pyvisa.ResourceManager()
instrument_address = 'USB0::0x2A8D::0x0101::MY12345678::INSTR'

with rm.open_resource(instrument_address) as inst:
    # Setup measurement
    inst.write('CONF:VOLT:DC 10,0.001')

    # Collect 5 measurements
    measurements = []

    for i in range(5):
        voltage = float(inst.query('READ?'))
        measurements.append({
            'timestamp': datetime.now(),
            'reading_number': i + 1,
            'voltage_v': voltage
        })
        print(f"Reading {i+1}: {voltage:.3f} V")

    # Save to CSV
    df = pd.DataFrame(measurements)
    df.to_csv('voltage_measurements.csv', index=False)
    print("Data saved to voltage_measurements.csv")
Open voltage_measurements.csv - you’ll see something like this (using dummy data for this example):
timestamp,reading_number,voltage_v
2026-01-09 14:23:01.123456,1,3.287
2026-01-09 14:23:01.234567,2,3.289
...
Step 5: Visualize the Data
Add these lines after saving the CSV:
import matplotlib.pyplot as plt

plt.plot(df['reading_number'], df['voltage_v'], 'o-')
plt.xlabel('Reading Number')
plt.ylabel('Voltage (V)')
plt.title('Voltage Measurements')
plt.grid(True)
plt.savefig('voltage_plot.png')
print("Chart saved to voltage_plot.png")
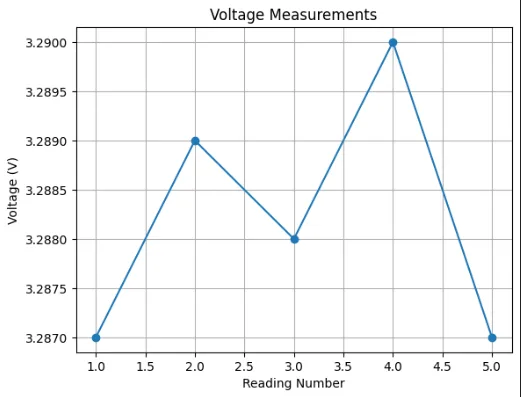
You’ll get a nice graph like this (generated with Matplotlib) showing your measurements; with the example dummy data it looks straightforward. In real tests, the recorded data can be much more complex and is useful for spotting drift or noise.
Level Up: Power Consumption Testing
Now let’s do something more practical—measure how much power your circuit draws at different voltages. This needs two instruments:
- Power supply (sets voltage)
- Multimeter (measures current)
We’ll build this in small steps so you can test as you go.
The Setup
Physical connections:
- Power supply (+) → Your circuit VCC
- Power supply (-) → Multimeter COM
- Multimeter INPUT → Your circuit GND
The multimeter sits “in series” to measure current flow.
Step 1: Single Test Point
Let’s start by testing one voltage (3.3V) and measuring the current:
import pyvisa
import time

rm = pyvisa.ResourceManager()

# Update these addresses to yours
psu = rm.open_resource('TCPIP::192.168.1.100::INSTR')  # Power supply
dmm = rm.open_resource('USB0::0x2A8D::0x0101::MY12345678::INSTR')  # Multimeter

# Set power supply to 3.3V
psu.write('VOLT 3.3')
psu.write('OUTP ON')  # Turn output ON
time.sleep(0.5)  # Let it stabilize

# Configure DMM to measure current (1A range, 1mA resolution)
dmm.write('CONF:CURR:DC 1,0.001')
current = float(dmm.query('READ?'))

# Calculate power
power = 3.3 * current

print(f"Voltage: 3.3V, Current: {current*1000:.1f}mA, Power: {power*1000:.1f}mW")

# Turn off supply
psu.write('OUTP OFF')
Expected output:
Voltage: 3.3V, Current: 45.2mA, Power: 149.2mW
Pro tip: Always add
time.sleep()after changing voltage. Power supplies need time to settle.
Step 2: Test Multiple Voltages
Now let’s sweep 3.0V, 3.3V, 3.6V, and 5.0V to see how current changes:
import pyvisa
import pandas as pd
from datetime import datetime
import time

rm = pyvisa.ResourceManager()
psu = rm.open_resource('TCPIP::192.168.1.100::INSTR')
dmm = rm.open_resource('USB0::0x2A8D::0x0101::MY12345678::INSTR')

# Configure DMM once
dmm.write('CONF:CURR:DC 1,0.001')

# Test these voltages
voltages = [3.0, 3.3, 3.6, 5.0]
results = []

print("Starting power sweep...")
for v in voltages:
    # Set voltage
    psu.write(f'VOLT {v}')
    psu.write('OUTP ON')
    time.sleep(0.5)  # Stabilize

    # Measure current
    current = float(dmm.query('READ?'))
    power = v * current

    # Save data
    results.append({
        'voltage': v,
        'current_a': current,
        'power_w': power,
        'timestamp': datetime.now()
    })

    print(f"{v}V: {current*1000:.1f}mA, {power*1000:.1f}mW")

# Turn off supply
psu.write('OUTP OFF')

# Save to CSV
df = pd.DataFrame(results)
df.to_csv('power_test.csv', index=False)
print("\nData saved to power_test.csv")
What you’ll see:
Starting power sweep...
3.0V: 42.1mA, 126.3mW
3.3V: 45.2mA, 149.2mW
3.6V: 48.7mA, 175.3mW
5.0V: 65.3mA, 326.5mW

Data saved to power_test.csv
Step 3: Add Error Handling
Equipment fails. Cables disconnect. Add safety:
def measure_power_at_voltage(psu, dmm, voltage):
    """Measure current and power at a specific voltage. Returns (current, power) or (None, None) on error."""
    try:
        psu.write(f'VOLT {voltage}')
        psu.write('OUTP ON')
        time.sleep(0.5)

        current = float(dmm.query('READ?'))
        power = voltage * current
        return current, power
    except Exception as e:
        print(f"⚠️ Error at {voltage}V: {e}")
        return None, None

# Use context managers for automatic cleanup
with rm.open_resource('TCPIP::192.168.1.100::INSTR') as psu, \
     rm.open_resource('USB0::0x2A8D::0x0101::MY12345678::INSTR') as dmm:

    dmm.write('CONF:CURR:DC 1,0.001')

    for v in [3.0, 3.3, 3.6, 5.0]:
        current, power = measure_power_at_voltage(psu, dmm, v)
        if current is not None:
            print(f"✓ {v}V: {current*1000:.1f}mA")
        else:
            print(f"✗ {v}V: Failed")

    psu.write('OUTP OFF')

# Instruments auto-close here, even if something crashed
Why this matters: If your script crashes halfway through, the power supply turns off automatically. No burnt circuits.

Safety Note: Always maintain a fire extinguisher in your laboratory. Automated testing often requires extended periods of unattended operation. Even with reliable electronics, implementing comprehensive fire safety precautions is essential laboratory practice. (Photo by Tak Kei Wong on Unsplash )
Step 4: Make It Reusable (Optional)
If you’re doing this often, wrap it in a class:
class SimplePowerTest:
    def __init__(self, psu_addr, dmm_addr):
        self.rm = pyvisa.ResourceManager()
        self.psu_addr = psu_addr
        self.dmm_addr = dmm_addr

    def run(self, voltages=[3.0, 3.3, 3.6, 5.0]):
        """Run power test at specified voltages. Returns list of results."""
        with self.rm.open_resource(self.psu_addr) as psu, \
             self.rm.open_resource(self.dmm_addr) as dmm:

            dmm.write('CONF:CURR:DC 1,0.001')
            results = []

            for v in voltages:
                psu.write(f'VOLT {v}')
                psu.write('OUTP ON')
                time.sleep(0.5)

                current = float(dmm.query('READ?'))
                power = v * current

                results.append({
                    'voltage': v,
                    'current': current,
                    'power': power
                })
                print(f"{v}V: {current*1000:.1f}mA")

            psu.write('OUTP OFF')
            return results

# Usage
test = SimplePowerTest(
    psu_addr='TCPIP::192.168.1.100::INSTR',
    dmm_addr='USB0::0x2A8D::0x0101::MY12345678::INSTR'
)
results = test.run()
Now you can reuse this in other scripts easily.
Quick Checklist Before Running
✓ Power supply connected to your circuit
✓ Multimeter in series (measures current between supply and circuit)
✓ Instrument addresses updated in the code
✓ Run python power_test.py
You’ll get:
- Console output showing progress
power_test.csvwith timestamped data- Easy-to-plot data for reports
Real-World Applications
Basics: Single-shot measurements, data logging, simple sweeps
Production patterns: Error handling, CI/CD integration
Power profiling: sweep supply voltage, log current draw. Interface checks: probe I2C/SPI/UART with a scope. RF work: automate sweeps with signal generators. Production: quick go/no-go tests.
CI/CD Integration (Advanced)
What is this? Running hardware tests automatically every time you push code to Git. If a code change breaks something, you find out immediately—not weeks later in production.
The challenge: Most CI/CD runners (GitHub Actions, GitLab CI) run in the cloud. But your instruments are sitting on your desk. How do you connect them?
The solution: Use a self-hosted runner—a computer in your lab that has access to the test instruments and runs your tests when code changes.
Physical Setup Required
You need:
- A dedicated computer (can be a Raspberry Pi, old laptop, or lab PC)
- Instruments connected to that computer (USB/LAN)
- Self-hosted runner software installed (free from GitHub/GitLab)
- Stable internet so it can talk to your Git repository
Think of it like this:
- Your code lives in GitHub/GitLab (the cloud)
- When you push changes, the cloud tells your lab computer “hey, run the tests”
- Your lab computer runs PyVISA scripts using real instruments
- Results get sent back to the cloud and show up in your pull request
Example: GitHub Actions with Self-Hosted Runner
Step 1: Set up the self-hosted runner
On your lab computer (the one connected to instruments):
# Download runner (Linux/Mac/Windows versions available)
# Go to: Your Repo → Settings → Actions → Runners → New self-hosted runner
# Follow the instructions shown there

# It will give you commands like:
./config.sh --url https://github.com/yourname/yourrepo --token YOUR_TOKEN
./run.sh
Step 2: Label your runner
When configuring, add a label like hardware-lab. This tells GitHub “only run hardware tests on this specific machine.”
Step 3: Create your workflow file
In your repo, create .github/workflows/hardware-tests.yml:
name: Hardware Tests

on:
  push:
    branches: [ main, dev ]
  pull_request:
    branches: [ main ]

jobs:
  hardware_validation:
    runs-on: self-hosted  # This tells GitHub to use your lab computer

    steps:
      - name: Checkout code
        uses: actions/checkout@v3

      - name: Set up Python
        uses: actions/setup-python@v4
        with:
          python-version: '3.10'

      - name: Install dependencies
        run: |
          pip install pyvisa pyvisa-py pytest

      - name: Run hardware tests
        run: |
          pytest tests/hardware/ --junitxml=test-results.xml -v
        timeout-minutes: 10  # Safety: kill if tests hang

      - name: Upload test results
        if: always()  # Upload even if tests fail
        uses: actions/upload-artifact@v3
        with:
          name: hardware-test-results
          path: test-results.xml
What happens when you push code:
- GitHub sees the new commit
- Sends signal to your lab computer: “Run hardware tests”
- Your lab computer:
- Downloads the latest code
- Installs dependencies
- Runs pytest with real instruments
- Uploads results back to GitHub
- You see ✅ or ❌ in your pull request
Example test file (tests/hardware/test_power_supply.py):
import pytest
import pyvisa

@pytest.fixture
def power_supply():
    """Connect to the power supply once per test session"""
    rm = pyvisa.ResourceManager()
    psu = rm.open_resource('TCPIP::192.168.1.100::INSTR')
    yield psu
    psu.write('OUTP OFF')  # Safety: turn off after tests
    psu.close()

def test_voltage_accuracy(power_supply):
    """Test that power supply outputs correct voltage"""
    power_supply.write('VOLT 3.3')
    power_supply.write('OUTP ON')
    time.sleep(0.5)

    # Read back actual voltage
    actual = float(power_supply.query('MEAS:VOLT?'))

    # Should be within 1% of 3.3V
    assert 3.267 <= actual <= 3.333, f"Voltage out of spec: {actual}V"

def test_current_limit(power_supply):
    """Test that current limiting works"""
    power_supply.write('VOLT 5.0')
    power_supply.write('CURR 0.5')  # 500mA limit
    power_supply.write('OUTP ON')
    time.sleep(0.5)

    # Try to draw more current (via external load)
    actual_current = float(power_supply.query('MEAS:CURR?'))

    # Should limit to 500mA ± 10mA
    assert actual_current <= 0.51, f"Current limit failed: {actual_current}A"
What you see in GitHub:
When tests run, you get:
- ✅ Green checkmark if all tests pass
- ❌ Red X if any test fails
- Detailed logs showing which specific test failed
- Downloadable test report (XML file)
Example: GitLab CI with Self-Hosted Runner
Similar concept, different syntax. Create .gitlab-ci.yml:
stages:
  - test

hardware_tests:
  stage: test
  tags:
    - hardware-lab  # Your runner's label
  script:
    - pip install pyvisa pyvisa-py pytest
    - pytest tests/hardware/ --junitxml=report.xml -v
  artifacts:
    when: always
    reports:
      junit: report.xml
  only:
    - main
    - merge_requests
Common Gotchas
Issue: “Runner can’t find instruments”
- Make sure instruments are powered on 24/7
- Add
rm.list_resources()to your test startup to verify connections - Check firewall settings on the runner machine
Issue: “Tests pass locally but fail in CI”
- Instrument might be in a different state (settings from previous test)
- Add reset commands:
inst.write('*RST')at test start - Use pytest fixtures to ensure clean state
Issue: “Tests timeout”
- Hardware tests are slower than unit tests
- Set reasonable timeouts (10-30 minutes)
- Parallel testing usually doesn’t work well with physical instruments
Is This Worth It?
Yes, if:
- You have firmware that controls hardware
- Bugs in production are expensive (automotive, medical, aerospace)
- You make frequent changes and want fast feedback
No, if:
- You’re prototyping and hardware changes daily
- Only one person works on the code
- Manual testing is good enough for your use case
Pro tip: Start with a single smoke test that just checks “can we connect to instruments?” Then gradually add more tests as you find bugs.
When Things Go Wrong
Common problems you’ll hit:
“list_resources() returns []”
- Check USB/LAN connections
- Install instrument drivers
- Try different connection types
“Timeout error”
Problem: Script hangs waiting for response Solutions:
- Increase timeout:
inst.timeout = 10000(10 seconds) - Check instrument is not busy
- Verify command syntax
“Wrong measurements”
Problem: Readings don’t make sense Solutions:
- Check range settings match your signals
- Verify probe connections (red/black wires)
- Compare with manual measurement
“Script crashes”
Problem: Unhandled errors stop execution Solution: Add try/except blocks
try:
    # Your measurement code
    voltage = inst.query('READ?')
except Exception as e:
    print(f"Error: {e}")
    # Cleanup code here
Testing the Tests – PyVISA Mocks & Simulation
No hardware? Two tools: PyVISA‑sim and pyvisa‑mock.
PyVISA‑sim — Deterministic Simulator Backend
- Link https://pyvisa.readthedocs.io/projects/pyvisa-sim/en/latest/
- Backend:
@sim(drop‑in for PyVISA) - Modeling style: YAML/config‑driven simulated instruments
- Use case: CI/CD pipelines, regression tests, sharing test configs
import pyvisa as visa
rm = visa.ResourceManager('@sim')
inst = rm.open_resource('SIM::DMM')
print(inst.query('*IDN?'))
print(inst.query('MEAS:VOLT:DC?'))
pyvisa‑mock — Dynamic, Code‑Driven Mocks
- Link: https://github.com/microsoft/pyvisa-mock
- Backend:
@mock - Modeling style: Python classes handle SCPI with decorators; great for stateful behavior, delays, binary payloads
- Strengths: Fast unit tests with per‑test customization; no need to edit YAML for special cases
from collections import defaultdict
from pyvisa import ResourceManager
from pyvisa_mock.base.base_mocker import BaseMocker, scpi
from pyvisa_mock.base.register import register_resource

class Channel(BaseMocker):
    def __init__(self):
        super().__init__()
        self._v = 0.0
    @scpi(':VOLTage <v>')
    def set_v(self, v: float):
        self._v = v
    @scpi(':VOLTage?')
    def get_v(self) -> float:
        return self._v

class MockPSU(BaseMocker):
    def __init__(self):
        super().__init__()
        self._ch = defaultdict(Channel)
    @scpi('*IDN?')
    def idn(self) -> str:
        return 'MockCo,PSU,00000,0.01'
    @scpi(':INSTR:CHANnel<idx>')
    def ch(self, idx: int) -> Channel:
        return self._ch[idx]

register_resource('MOCK0::psu::INSTR', MockPSU())
rm = ResourceManager(visa_library='@mock')
psu = rm.open_resource('MOCK0::psu::INSTR')
psu.write(':INSTR:CHANNEL1:VOLT 2.5')
print(psu.query(':INSTR:CHANNEL1:VOLT?'))
Testing Strategy - Decision Flow
flowchart TD
    Start([Need to Test]) --> HW{Hardware<br/>Available?}

    HW -->|Yes| RealHW[Test on Real Hardware]
    RealHW --> Doc[Document Results]

    HW -->|No| Type{Test Type?}

    Type -->|Unit Test| Mock[Use pyvisa-mock]
    Mock --> MockFeatures[Custom Behavior<br/>Error Injection<br/>State Management]

    Type -->|Integration Test| Sim[Use PyVISA-sim]
    Sim --> SimFeatures[YAML Configuration<br/>Shared Scenarios<br/>CI/CD Integration]

    Type -->|Both| Hybrid[Hybrid Approach]
    Hybrid --> HybridFeatures[Mock for Units<br/>Sim for Integration]

    MockFeatures --> Validate
    SimFeatures --> Validate
    HybridFeatures --> Validate

    Validate{Validate Against<br/>Real HW?}
    Validate -->|Weekly| Contract[Contract Tests]
    Validate -->|Release| Full[Full Regression]
    Contract --> Doc
    Full --> Doc

    Doc --> End([End])

    style Start fill:#90EE90
    style End fill:#90EE90
    style RealHW fill:#87CEEB
    style Mock fill:#FFD700
    style Sim fill:#FFA500
    style Hybrid fill:#FF6B6B
PyVISA-sim for CI. pyvisa-mock for unit tests with custom behavior.
Keep SCPI strings in a single adapter layer and validate against hardware periodically.
Version control your configs and mocks. Snapshot I/O (SCPI sent/received) with timestamps. Seed randomness and fix ranges/triggers. Fail fast on errors—assert empty error queues in teardown. Run weekly tests on real hardware to catch drift.
Debugging Automated Measurements
Send SCPI commands manually first. Capture the exact strings your script uses. Log all I/O with timestamps. Store instrument ID and settings next to the data.
Reduce the setup: one instrument, simple DUT. Add pieces back gradually. Compare against a handheld meter to catch gross errors.
Designing Automation‑Friendly Embedded Tests (Not Just Scripts)
Production rules for tests that last:
Split your code: configuration, acquisition, processing, reporting. Keep them separate.
Use fixed ranges and explicit triggers. No auto-ranging in production tests.
Save raw data with metadata. Generate quick plots so you can eyeball results.
Wrap instruments in adapters so you can swap hardware without rewriting tests.
graph TB
    subgraph Test_Bench["Test Bench Architecture"]
        subgraph Core["Core Components"]
            Orch[Test Orchestrator]
        end

        subgraph Adapters["Adapter Layer"]
            InstAdapter[Instrument Adapter]
            DutAdapter[DUT Controller]
        end

        subgraph Services["Services"]
            Logger[Logger/Report]
            Config[Configuration]
            DataProc[Data Processing]
        end

        subgraph Hardware["Hardware Interface"]
            VISA[VISA Backend]
            Serial[Serial/UART]
            Debug[Debug Probe/SWD]
        end
    end

    subgraph Physical["Physical Layer"]
        OSC[Oscilloscope]
        DMM[Multimeter]
        PSU[Power Supply]
        DUT[Device Under Test]
    end

    Orch -->|Configure| InstAdapter
    Orch -->|Control| DutAdapter
    Orch -->|Log Results| Logger
    Orch -->|Load Settings| Config
    Orch -->|Process| DataProc

    InstAdapter -->|SCPI/VISA| VISA
    DutAdapter -->|Commands| Serial
    DutAdapter -->|Flash/Debug| Debug

    VISA -->|Control| OSC
    VISA -->|Measure| DMM
    VISA -->|Power| PSU

    Serial -->|UART| DUT
    Debug -->|SWD/JTAG| DUT
    PSU -->|Supply| DUT
    OSC -->|Probe| DUT
    DMM -->|Measure| DUT

    Logger -->|Generate| Report[Test Report]
    DataProc -->|Analyze| Metrics[Metrics & Plots]

    style Orch fill:#90EE90
    style DUT fill:#FFB6C1
    style Logger fill:#87CEEB
    style Report fill:#FFD700
Small, focused tests. Clear failure messages.
The difference between a throwaway script and a real test: the script works once on your bench. The test works next month when someone else runs it on different hardware.
Architecture matters. Don’t dump everything into one 500-line function. Separate config (YAML/JSON), acquisition (SCPI loops), processing (pandas), and reporting (CSV/plots). When the DMM dies and you swap in a different model, you edit one adapter class instead of hunting through spaghetti code.
Kill auto-ranging in production. Fixed ranges only. CONF:VOLT:DC 10,0.001 means 10V range, 1mV resolution—every time. Auto-ranging adds jitter and makes timing unpredictable.
Triggers sync instruments. Instead of guessing with time.sleep(), use TRIG:SOUR BUS (instrument waits for your trigger command) and *OPC? (blocks until operation completes, returns ‘1’). Set PSU voltage → wait for *OPC? → trigger DMM. No race conditions.
Retry logic. Instruments flake out. Network glitches. Busy errors. Wrap measurements in retries:
def measure_with_retry(inst, max_attempts=3):
    for attempt in range(max_attempts):
        try:
            inst.write('INIT')
            inst.query('*OPC?')
            return float(inst.query('FETC?'))
        except:
            if attempt < max_attempts - 1:
                time.sleep(1)
                inst.clear()  # Clear error queue
            else:
                raise
Use context managers. Instruments lock up when scripts crash. Python’s with statement auto-closes connections:
with rm.open_resource(addr) as inst:
    reading = inst.query('MEAS:VOLT:DC?')
# Cleanup happens automatically
Save raw data. Always. Processed CSV is nice but raw SCPI responses plus timestamps let you debug weird issues later. Instrument said what? Check the log.
Quick plots. Generate a PNG so you can eyeball if the test even makes sense. Voltage should ramp up smoothly, not spike randomly.
Critical SCPI commands:
*RST- Reset instrument to known state*CLS- Clear error queue*OPC?- Wait for operation complete (returns ‘1’)SYST:ERR?- Query error queue (check in teardown)*IDN?- Verify you’re talking to the right instrument
Small tests with clear failures beat giant test suites that fail mysteriously. If a test fails, the message should say “PSU current limit tripped at 3.3V” not “AssertionError line 487”.
References
- PyVISA: https://pyvisa.readthedocs.io/
- SCPI Overview: https://en.wikipedia.org/wiki/Standard_Commands_for_Programmable_Instruments
- pyvisa‑sim: https://pyvisa-sim.readthedocs.io/
- pyvisa‑mock: https://github.com/microsoft/pyvisa-mock
Keysight, Rohde & Schwarz, Tektronix programming manuals for your instruments
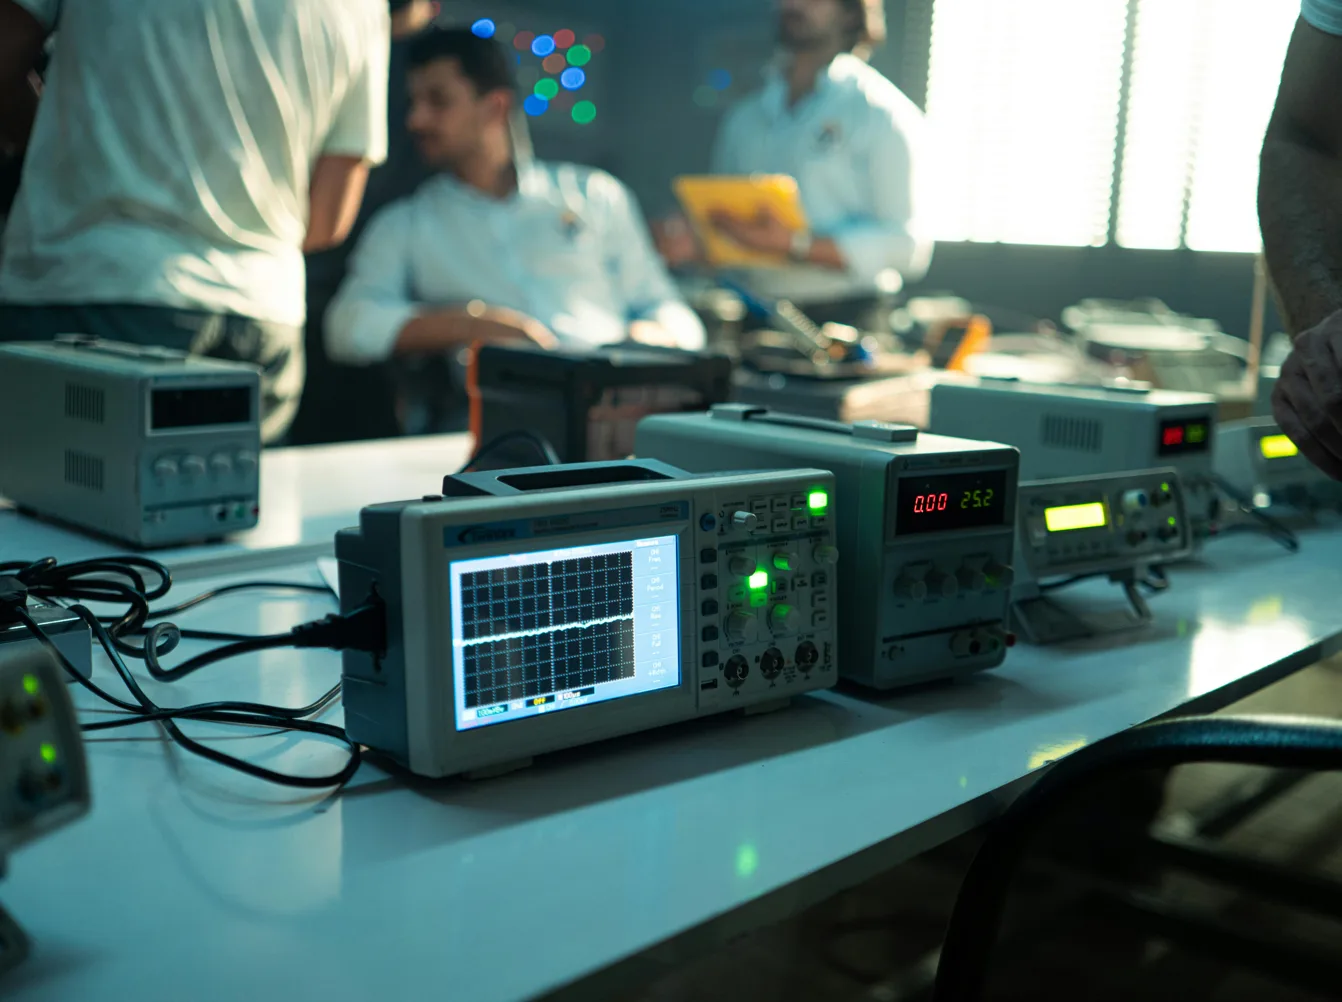
Cover image: Photo by khezez خزاز: https://www.pexels.com/photo/electronics-lab-with-oscilloscopes-and-engineers-34007241/